
1
Follow
1794
Followers
[trans]
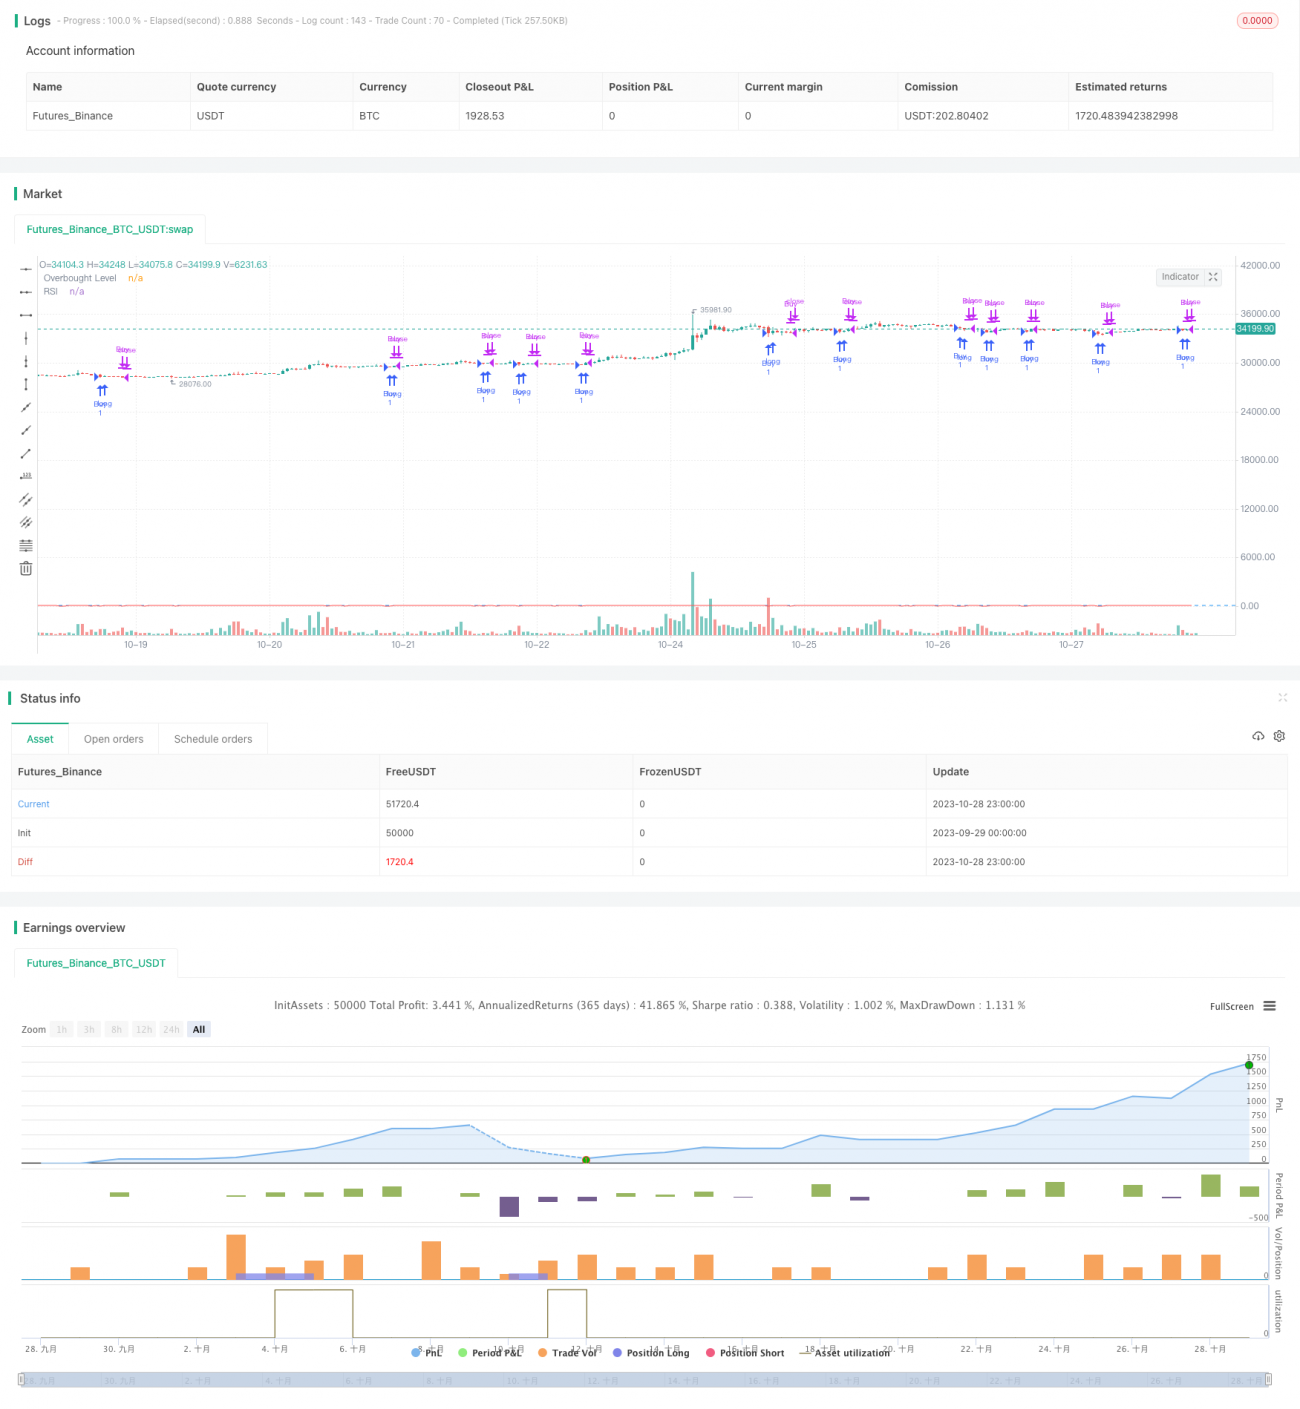
개요
저점 반등 전략은 간단하면서도 효과적인 주식 거래 전략입니다. 이 전략은 저점 반등 기회를 포착하여 주가가 반등 상승할 때 시장에 진입하고, 단기 운용을 통해 수익을 낸 후 빠르게 손절하며 청산합니다.
전략 원리
해당 전략은 주로 두 가지 지표에 기반합니다: 진입 시점을 결정하는 5일 최저가와 청산 시점을 결정하는 2일 RSI입니다.
구체적인 실행 절차는 다음과 같습니다:
- 당일 종가가 전일의 5일 최저가보다 낮으면, 당일 종가에 매수 진입합니다.
- 2일 RSI가 과매수 구간(기본값 50) 이상으로 종가를 형성하면, 당일 종가에 포지션을 청산하여 이익을 실현합니다.
- 진입 후 5일 이내에 이익 실현 조건이 발생하지 않으면, 강제 손절매하여 청산합니다.
이를 통해 주가가 반등 상승하는 핵심 지점 부근에서 매수 진입하고, RSI 과매수 신호를 이용해 이익을 확정하며, 시간 제한 손절매를 통해 위험을 통제합니다.
장점 분석
이 전략은 다음과 같은 장점을 가지고 있습니다:
- 조작이 간단하고 실행이 용이합니다. 두 가지 지표만 관찰하면 되며 규칙이 명확하여 신속한 거래 결정을 내릴 수 있습니다.
- 추세 반전 아이디어를 채택하여 주가가 반등 상승하기 전에 진입함으로써 큰 흐름을 포착합니다.
- 이익 실현 및 손절매 지점을 설정하여 단일 손실을 통제하고 안정적인 수익을 실현할 수 있습니다.
- 자금 회전이 빠르며 오랜 대기 시간이 필요하지 않아 여러 번 반복 거래가 가능합니다.
- 대부분의 주식, 특히 단기 저점 반전 특성이 뚜렷한 주식에 광범위하게 적용할 수 있습니다.
위험 분석
이 전략은 다음과 같은 위험도 존재합니다:
- 반전 시점을 잘못 선택하면 손실이 발생할 수 있습니다. 반전 시점 판단에는 실제 경험이 필요합니다.
- 손절매 지점을 잘못 설정하면 손실이 확대될 수 있습니다. 합리적인 손절매 폭을 고려해야 합니다.
- 시세가 횡보하면 이익 실현 지점이 발동되기 어렵습니다. RSI 파라미터를 적절히 조정할 수 있습니다.
- 단기 운용에만 적합하며 장기 보유에는 부적합합니다.
- 높은 회전율은 거래 비용과 슬리피지 비용을 증가시킵니다.
최적화 방향
다음과 같은 측면에서 이 전략을 추가로 최적화할 수 있습니다:
- 추세 지표를 결합하여 역추세 운용을 피합니다. 예: MACD, KDJ 등.
- 다양한 일수 최저가 파라미터를 테스트하여 더 적합한 반전 확인 지표를 찾습니다.
- RSI 파라미터 크기를 테스트하여 이익 실현 조건을 최적화합니다.
- ATR을 통해 동적으로 손절매 지점을 설정하는 손절매 최적화 모듈을 도입하는 것을 고려합니다.
- 진입 시점을 최적화하여 반전 확인 후 진입 대기함으로써 가짜 돌파를 걸러냅니다.
- 거래 비용을 고려한 후 합리적인 이익 실현 목표를 설정합니다. 거래 빈도를 통제합니다.
결론
저점 반등 전략은 전형적인 단기 운용 전략입니다. 저점 반등의 거래 기회를 포착하고, 간단한 지표 조합을 사용해 진입 시점 및 청산 시점을 판단하여 빠른 이익 실현 및 손절매를 실현합니다. 매수 후 보유 전략에 비해 이 전략은 위험 대비 수익률이 더 높은 장점을 가지고 있습니다. 지속적인 파라미터 및 규칙 최적화를 통해 이 전략은 대부분의 주식 특성에 적응하여 안정적인 수익을 얻을 수 있습니다. 다만 과도한 빈번한 거래로 인한 거래 비용 문제에 주의해야 합니다. 전반적으로 저점 반등 전략은 간단하면서도 실용적이고 효과적인 주식 거래 전략입니다.
Source
Pine
/*backtest
start: 2023-09-29 00:00:00
end: 2023-10-29 00:00:00
period: 1h
basePeriod: 15m
exchanges: [{"eid":"Futures_Binance","currency":"BTC_USDT"}]
*/

// This source code is subject to the terms of the Mozilla Public License 2.0 at https://mozilla.org/MPL/2.0/
// © hobbiecode

// If today’s close is below yesterday’s five-day low, go long at the close.Related strategies
Comment
All comments (0)
No data
- 1