
이 전략은 부린 띠 지표와 이동 평균을 기반으로 가격이 부린 띠에 가까워질 때 LONG 또는 SHORT 평점을 취하여 수익을 얻습니다. 부린 띠를 돌파 할 때 상향; 부린 띠를 돌파 할 때 상향. 두 가지 거래 전략의 장점을 결합합니다.
이 전략은 다음과 같은 두 가지 입문 신호를 판단합니다.
다수수 신호: 종착 가격이 하향 궤도에 닿고, 종착 가격이 EMA 평균선보다 높을 때, 전 K선 엔터티가 음선이고, 현재 K선 엔터티가 양선일 때 더 한다.
공백 신호: 종착 가격이 상대를 만지고, 종착 가격이 EMA 평균선보다 낮아지고, 전 K선 엔터티가 양선이고, 현재 K선 엔터티가 음선일 때 공백한다.
스톱로스 방식: 고정 스톱로스. 스톱로스 포인트는 출구 가격과 상대방의 궤도 거리의 위험수익률의 몇 배이다.
정지방법: 타겟이 적의 선로로 니다. 즉, 다중 정지방은 하단 선로, 공백 정지방은 상단 선로 니다.
트렌드 및 역전 전략의 장점을 결합하여 트렌드 흔들림 상황에서 더 잘 수행한다.
부린 띠 지표를 사용하여 과매매 지역을 판단하고, 역전 기회를 정확하게 판단하십시오.
고정 스톱포인트는 합리적으로 설정되어 위험을 통제하는데 도움이 됩니다.
모바일 결제 방식은 수익을 극대화합니다.
은 전략은 중개되기 쉽기 때문에 가짜 을 조심해야 한다.
“무엇을 할 수 있는지에 대한 판단을 내리는 것은 매우 중요합니다.
고정 스톱 손실은 시장의 변동에 따라 조정할 수 없으며, 너무 완만하거나 너무 급진적일 수 있다.
브린 밴드 매개 변수가 적절하지 않은 경우, 결과가 좋지 않을 수 있습니다.
결합 RSI 지표 필터 입력 신호를 고려 할 수 있습니다. 예를 들어 RSI 50 이상은 다시 더하고, RSI 50 이하는 다시 빈, 잘못된 신호를 피할 수 있습니다.
고정 스톱 거리를 자동으로 조정하는 기능을 추가하여 스톱 거리를 더 유연하게 만듭니다. 예를 들어, ATR 지표에 따라 스톱 거리를 동적으로 설정합니다.
브린 대역 변수를 최적화하여 최적의 변수 조합을 찾습니다.
다양한 EMA 평균선 파라미터를 테스트하여 평균선의 방벽강 효과를 최적화할 수 있다.
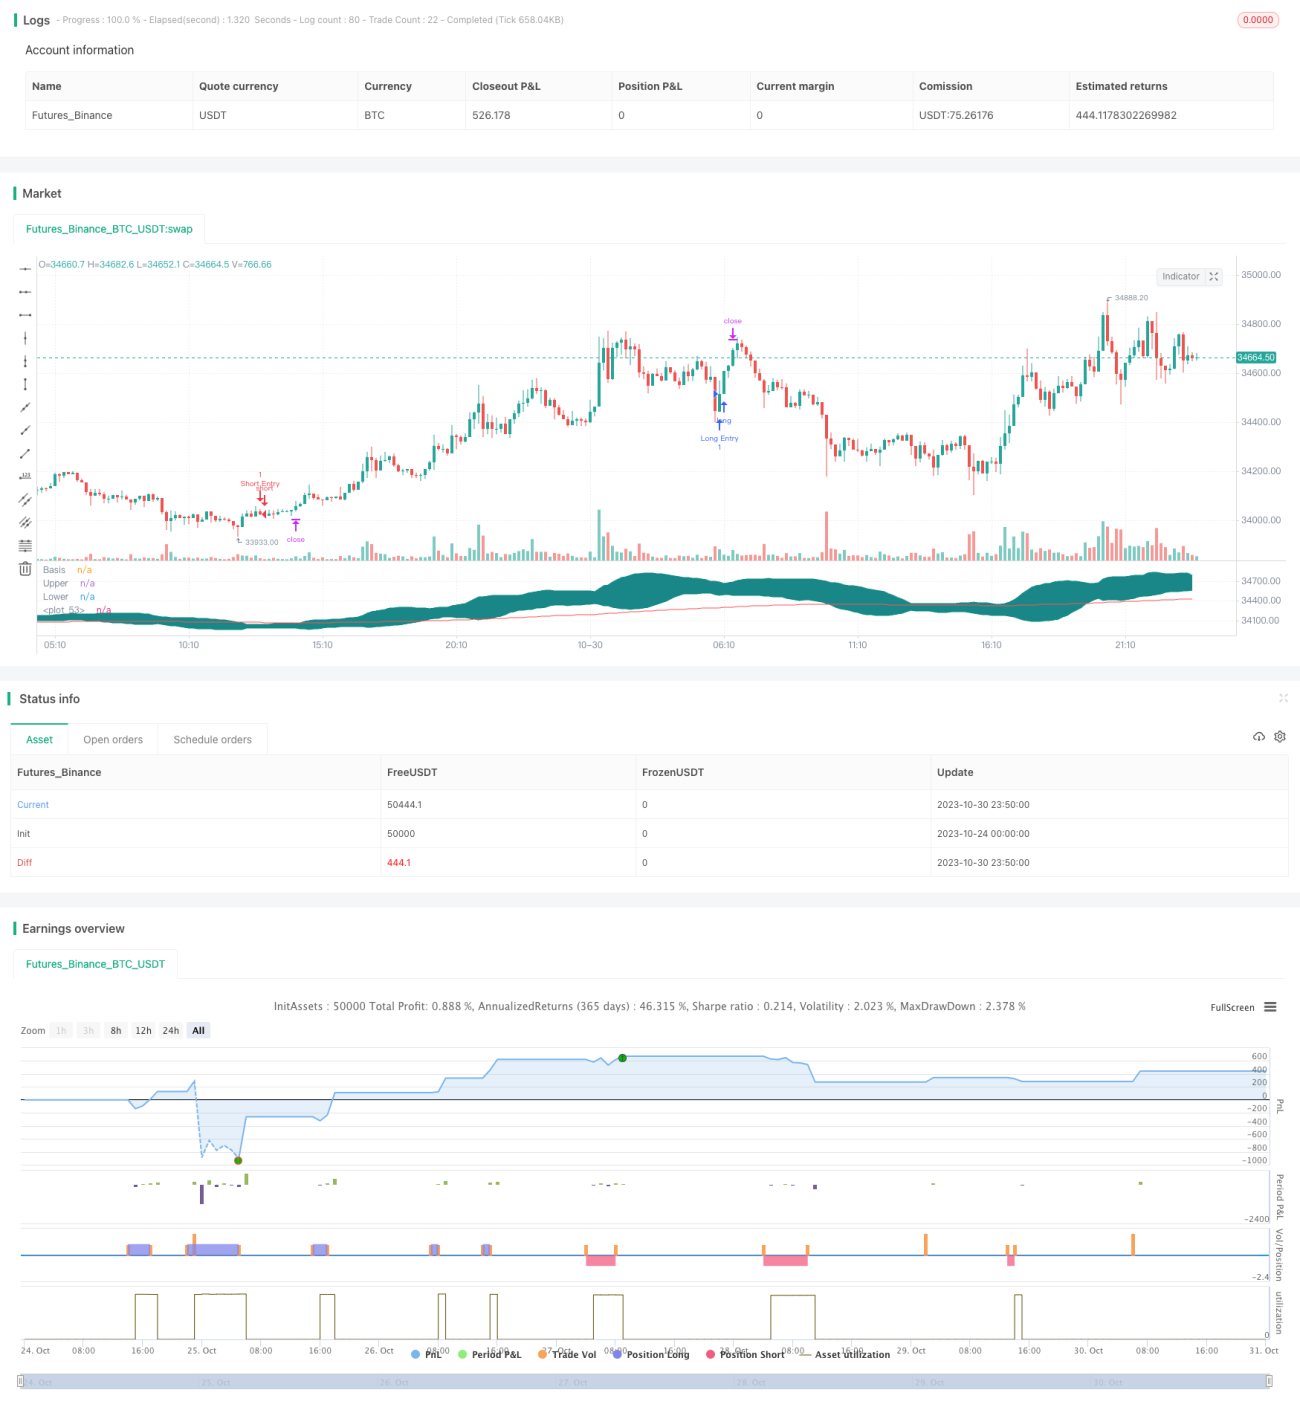
이 전략은 종합적으로 추세와 반전을 고려하고, 브린띠를 이용하여 과매매 과매매 입점을 판단하고, 이동식 스톱을 통해 이익을 극대화한다. 추세 흔들림 상황에서 더 좋은 성능을 발휘한다. 그러나 피난 현상을 예방하는 데 주의를 기울여야 하며, 동시에 변수를 조정하여 전략 효과를 최적화한다. 전체적으로 비교적 실용적인 효율적인 전략이다.
/*backtest
start: 2023-10-24 00:00:00
end: 2023-10-31 00:00:00
period: 10m
basePeriod: 1m
exchanges: [{"eid":"Futures_Binance","currency":"BTC_USDT"}]
*/
//@version=4
// Welcome to yet another script. This script was a lot easier since I was stuck for so long on the Donchian Channels one and learned so much from that one that I could use in this one
// This code should be a lot cleaner compared to the Donchian Channels, but we'll leave that up to the pro's
// This strategy has two entry signals, long = when price hits lower band, while above EMA, previous candle was bearish and current candle is bullish
// Short = when price hits upper band, while below EMA, previous candle was bullish and current candle is bearish
// Take profits are the opposite side's band(lower band for long signals, upper band for short signals). This means our take profit price will change per bar
// Our stop loss doesn't change, it's the difference between entry price and the take profit target divided by the input risk reward
// At the time of writing this, I could probably calculate that much easier by simply multiplying the opposite band by the input risk reward ratio
// Since I want to get this script out and working on the next one, I won't clean that up, I'm sorry
// strategy(shorttitle="BB Trending Reverse Strategy", title="Bollinger Bands Trending Reverse Strategy", overlay=true, default_qty_type = strategy.cash, default_qty_value = 150, initial_capital = 1000, currency = currency.USD, commission_type = "percent", commission_value = 0.036)
// The built-in Bollinger Band indicator inputs and variables, added some inputs of my own and organised the code
length = input(20, minval=1)
src = input(close, title="Source")
mult = input(2.0, minval=0.001, maxval=50, title="StdDev")
emaInput = input(title = "EMA Input", type = input.integer, defval = 200, minval = 10, maxval = 400, step = 1)
riskreward = input(title = "Risk/Reward Ratio", type = input.float, defval = 1.50, minval = 0.01, maxval = 100, step = 0.01)
offset = input(0, "Offset", type = input.integer, minval = -500, maxval = 500)
basis = sma(src, length)
dev = mult * stdev(src, length)
upper = basis + dev
lower = basis - dev
ema = ema(close, emaInput)
// These are our conditions as explained above
entryLong = low[1] <= lower[1] and low <= lower and low > ema
entryShort = high[1] >= upper[1] and high >= upper and high < ema
reversecandleLong = close > open and close[1] < open[1]
reversecandleShort = close < open and close[1] > open[1]
var stopLong = 0.0
var stopShort = 0.0
// These are our entry signals, notice how the stop condition is within the if statement while the strategy.exit is outside of the if statement, this way the take profit targets trails up or down depending on what the price does
if reversecandleLong and entryLong and strategy.position_size == 0
stopLong := (((close / upper - 1) * riskreward + 1) * close)
strategy.entry("Long Entry", strategy.long, comment = "Long Entry")
strategy.exit("Exit Long", "Long Entry", limit = upper, stop = stopLong, comment = "Exit Long")
if reversecandleShort and entryShort and strategy.position_size == 0
stopShort := (((close / lower - 1) / riskreward + 1) * close)
strategy.entry("Short Entry", strategy.short, comment = "Short Entry")
strategy.exit("Exit Short", "Short Entry", limit = lower, stop = stopShort, comment = "Exit Short")
// The built-in Bollinger Band plots
plot(basis, "Basis", color=#872323, offset = offset)
p1 = plot(upper, "Upper", color=color.teal, offset = offset)
p2 = plot(lower, "Lower", color=color.teal, offset = offset)
fill(p1, p2, title = "Background", color=#198787, transp=95)
plot(ema, color=color.red)
// These plots are to check the stoplosses, they can make a mess of your chart so only use these if you want to make sure these work
// plot(stopLong)
// plot(stopShort)