
개요
슈퍼동력전략은 여러 동력지표들을 종합적으로 사용하여, 여러 동력지표들이 동시에 부진하거나 부진할 때, 구매하거나 판매하는 작업을 수행한다. 이 전략은 여러 동력지표들을 조합함으로써, 가격 트렌드를 더 정확하게 포착할 수 있으며, 단일 지표에 의한 잘못된 신호를 피할 수 있다.
전략 원칙
이 전략은 4개의 에버젯의 RMI 지표와 1개의 <unk>데 동력 흔들림 지표를 동시에 사용한다. RMI 지표는 가격 동력을 기반으로 계산되어 가격 상승과 하락의 힘을 판단한다. <unk>데 MO는 가격 변화를 계산하여 시장의 과매매 상황을 판단한다.
RMI5에서 구매 라인을 통과하고, RMI4에서 구매 라인을 통과하고, RMI3에서 구매 라인을 통과하고, RMI2에서 구매 라인을 통과하고, RMI1에서 구매 라인을 통과하고, Chande MO에서 구매 라인을 통과하면 구매 작업이 수행됩니다.
RMI5 아래에서 판매 라인을 통과할 때, RMI4 위에서 판매 라인을 통과할 때, RMI3 위에서 판매 라인을 통과할 때, RMI2 위에서 판매 라인을 통과할 때, RMI1 위에서 판매 라인을 통과할 때, 그리고 Chande MO 아래에서 판매 라인을 통과할 때, 판매 작업을 수행한다.
RMI5는 다른 RMI 지표와 반대 방향으로 설정되어 있으며, 이는 트렌드를 더 잘 식별하여 피라미드 조작을 할 수 있다.
우위 분석
-
여러 지표를 통합하여 트렌드를 더 정확하게 판단하여 단일 지표의 잘못된 신호를 피합니다.
-
더 큰 수준의 트렌드를 식별할 수 있는 다중 시기를 포함하는 지표
-
역 RMI 지표는 트렌드 식별과 피라미드 조작을 보조할 수 있습니다.
-
<unk>데 MO는 과매도에서 잘못된 거래를 방지하는 데 도움이 됩니다.
위험 분석
-
과다한 지표 조합, 복잡한 변수 설정, 세심한 테스트와 최적화
-
여러 지표가 동시에 변하면 잘못된 신호가 발생할 수 있습니다.
-
여러 지표를 종합하면 거래 빈도가 낮을 수 있습니다.
-
다양한 품종과 시장 환경에 적합한 지표 파라미터를 고려해야 합니다.
최적화 방향
-
테스트 지표 매개 변수 설정, 최적화 매개 변수 전략 안정성을 높이기 위해
-
신호 품질에 미치는 영향을 평가하기 위해 몇 가지 지표를 추가하거나 줄이도록 시도하십시오.
-
특정 시장 상황에서의 잘못된 신호를 방지하기 위해 필터링 조건을 도입할 수 있습니다.
-
지표의 매매선 위치를 조정하여 최적의 변수 조합을 찾습니다.
-
위험을 통제하기 위한 손해제도 도입을 고려
요약하다
이 전략은 여러 가지 동적 지표를 종합적으로 사용함으로써 시장 추세를 판단하는 능력을 향상시킵니다. 그러나 파라미터를 설정하는 것은 복잡하며 신중하게 테스트하고 최적화하고 지속적으로 개선하고 조정해야합니다. 적절하게 사용하면 우수한 거래 신호를 얻을 수 있으며 시장 추세를 추적하는 데 약간의 장점이 있습니다. 그러나 거래자는 여전히 위험을 주의하고 최적의 파라미터 포지션을 찾고 위험 제어 장치에 참여하여 안정적인 거래를해야합니다.
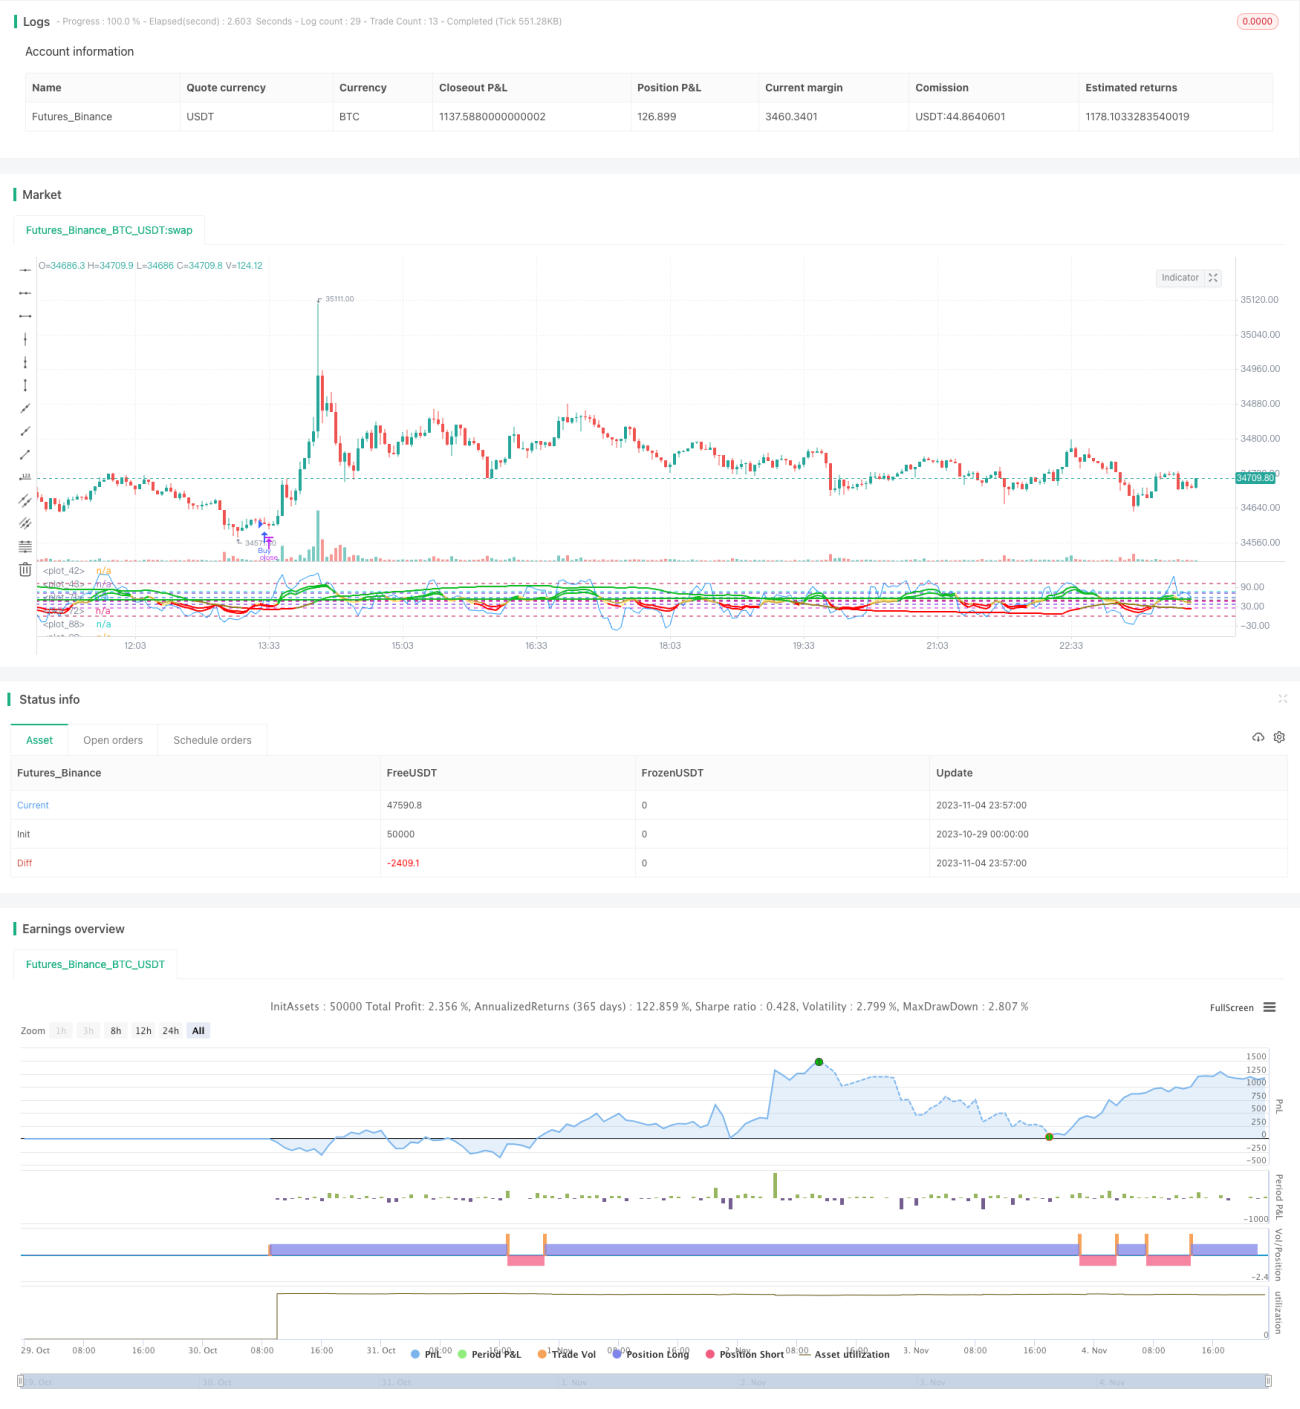
/*backtest
start: 2023-10-29 00:00:00
end: 2023-11-05 00:00:00
period: 3m
basePeriod: 1m
exchanges: [{"eid":"Futures_Binance","currency":"BTC_USDT"}]
*/

//@version=4
strategy(title="Super Momentum Strat", shorttitle="SMS", format=format.price, precision=2)

//* Backtesting Period Selector | Component *//- 1