슈퍼 이치모쿠 트렌드 전략


생성 날짜: 2023-11-06 16:32:11 마지막으로 수정됨: 2023-11-06 16:32:11
복사: 0 클릭수: 1427
avatar of ChaoZhang ChaoZhang
1
집중하다
1617
수행원

슈퍼 이치모쿠 트렌드 전략

개요

1위 전략은 1위 지표를 기반으로 거래 결정을 하는 트렌드 거래 전략이다. 이 전략은 1위 지표의 전환선, 기준선 및 클라우드 밴드의 관계를 사용하여 현재 트렌드 방향을 판단하고 가격의 회귀와 결합하여 입장을 수행한다.

1위 전략은 주로 중장선 트렌드 거래에 적용되며, 큰 트렌드에서 수익을 얻을 수 있다. 이 전략은 동시에 강한 트렌드 식별 능력을 가지고 있다.

전략 원칙

이 전략은 다음과 같은 요소를 고려하여 거래 방향을 결정합니다.

  1. 전환선과 기준선 사이의 관계:이 변동선은 상향을 보거나 하향을 보거나 하향으로 움직입니다.

  2. 구름의 색깔:구름이 초록색이면 오리, 빨간색이면 하락

  3. 가격 조정:가격 회수 전환선과 기준선 이외의 시장에 진입할 수 있습니다.

특히, 전략의 거래 신호는 다음과 같습니다.

“이봐요.

  • 변동선은 기준선보다 높습니다.
  • 가격의 전환선과 기준선보다 높은
  • 전환선과 기준선보다 높은 구름대
  • 가격 회수 전환선과 기준선 아래

“이봐, 이봐.

  • 전환선 아래의 기준선
  • 변동선과 기준선보다 낮은 가격
  • 전환선과 기준선 아래의 구름대
  • 가격 회수 전환선과 기준선 위에

동시에 더/무료 신호가 충족될 때, 포지션 상황에 따라 포지션 개시 작업이 진행된다.

우위 분석

이 전략은 다음과 같은 장점을 가지고 있습니다.

  1. 트렌드 방향을 판단하기 위해 1 이상의 지표 조합을 사용하여 높은 정확도를 얻습니다.

  2. 전환선과 기준선은 중단기 경향을 명확하게 판단하고, 구름띠는 장기 경향을 판단합니다.

  3. 조건은 가격의 회전선을 회수하여 가짜 돌파구로 인한 손실을 방지합니다.

  4. 리스크 컨트롤은 단위 손실을 효과적으로 제어할 수 있는 최근 최저 가격의 정지값을 사용합니다.

  5. 이윤이 적당하고, 안정적인 수익을 추구한다.

  6. 다양한 주기에서 적용할 수 있으며, 중·장선 트렌드 거래에 적합하다

  7. 전략이 명확하고 이해하기 쉽다.

  8. 다양한 시장 환경에서 잘 작동합니다.

위험 분석

이 전략에는 다음과 같은 위험도 있습니다.

  1. 불안한 시장에서, 정지 손실은 자주 발생하여 수익 효과에 영향을 미칠 수 있습니다.

  2. 트렌드가 급격히 변할 때, 적시에 역전할 수 없는 것은 손실을 초래할 수 있습니다.

  3. 설정된 이익/손실 비율은 모든 품종에 적합하지 않으며, 다른 기준에 대한 조정 매개 변수가 필요합니다.

  4. 클라우드 을 뚫고 올라가는 데 제한된 공간이 있으면 수익이 제한될 수 있습니다.

  5. 지표 매개 변수는 반복 테스트 최적화가 필요하며, 매개 변수 조정 빈번한 품종에는 적합하지 않습니다.

위험은 다음과 같은 방법으로 줄일 수 있습니다.

  1. 다른 주기 및 품종 특성에 더 적합하도록 최적화 매개 변수

  2. 다른 지표와 함께 진입 신호를 필터링하여 흔들리는 시장에서 가짜 돌파구를 피하십시오.

  3. 동적으로 중지 위치를 조정하여 중지되는 확률을 낮춘다.

  4. 다른 수익률 설정을 테스트합니다.

  5. 그래프 형태와 같은 방법을 사용하여 트렌드 신호의 강도를 결정합니다.

최적화 방향

이 전략은 다음과 같은 측면에서 최적화될 수 있습니다.

  1. 거래되는 품종의 특성에 맞게 변환 라인 및 기준 라인 매개 변수를 최적화

  2. 클라우드 반지 매개 변수를 최적화하여 클라우드 반지가 장기적인 추세를 더 정확하게 판단할 수 있도록 합니다.

  3. ATR에 따라 중지 또는 동적 중지 설정과 같은 최적화된 중지 알고리즘

  4. 다른 지표와 결합하여 신호 필터링을 수행하여 필터링 조건을 더 많이 설정하여 잘못된 진입 확률을 감소시킵니다.

  5. 다른 품종과 주기적인 특성에 따라 전략을 적용하는 적당률 설정을 최적화

  6. 마틴겔 방식의 포지션을 관리하고, 시장의 다양한 변동 빈도에 적응합니다.

  7. 기계 학습 방법을 사용하여 매개 변수를 최적화하여 더 높은 안정성을 달성합니다.

  8. 다른 거래 시간대를 설정하여 야간 거래와 거래 사이의 거래 특성에 맞게 조정합니다.

요약하다

1위 전략은 전체적으로 중장선 트렌드 거래에 매우 적합한 전략이다. 1위 지표를 사용하여 트렌드 방향을 판단하는 장점이 분명하며, 가격 회귀와 결합하여 입장은 잘못 입장을 효과적으로 피할 수 있다. 최적화 매개 변수 설정을 통해 전략은 더 많은 품종과 더 많은 주기에서 안정적인 수익을 얻을 수 있다. 이 전략은 이해하기 쉽고, 큰 최적화 공간이 있어 전략 연구 및 학습의 기본 전략 중 하나로 적합하다.
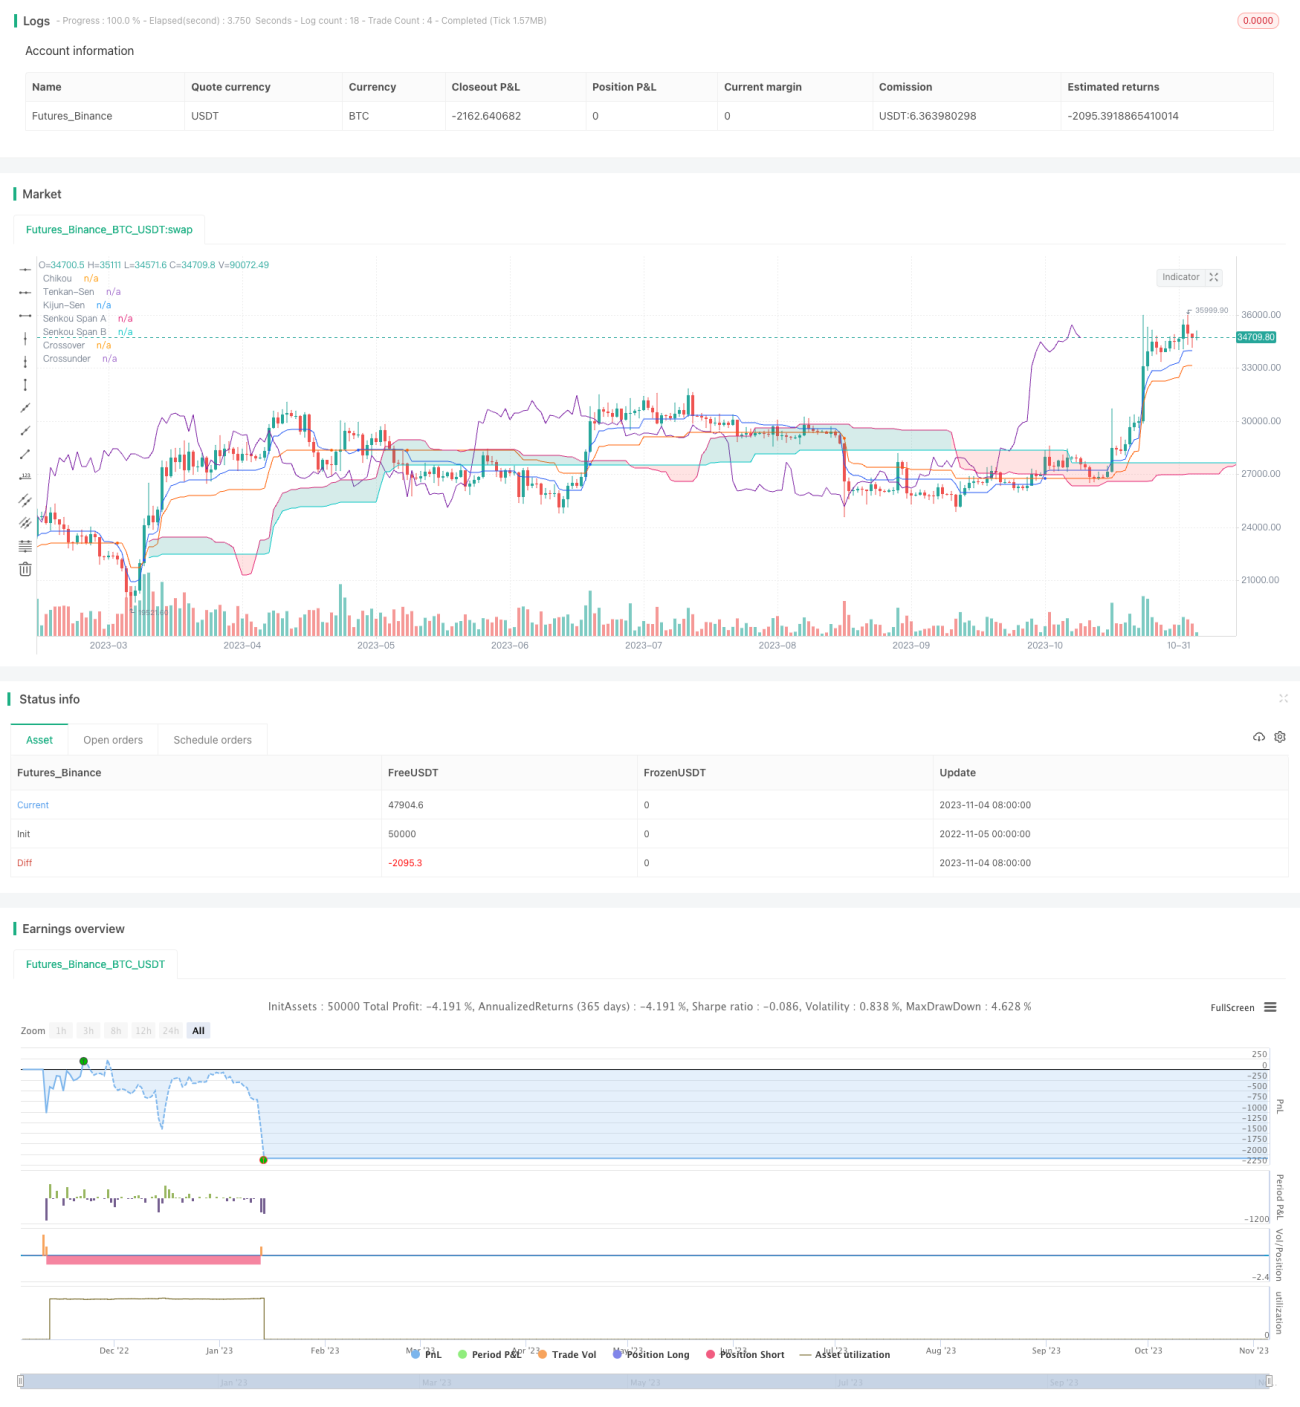
전략 소스 코드
/*backtest
start: 2022-11-05 00:00:00
end: 2023-11-05 00:00:00
period: 1d
basePeriod: 1h
exchanges: [{"eid":"Futures_Binance","currency":"BTC_USDT"}]
*/

// Strategy based on the the SuperIchi indicator.
//
// Strategy was designed for the purpose of back testing. 
// See strategy documentation for info on trade entry logic.
// 
// Credits:
//  - SuperIchi [LUX]: LuxAlgo (https://www.tradingview.com/script/vDGd9X9y-SuperIchi-LUX/)

//@version=5
strategy("SuperIchi Strategy", overlay=true, initial_capital=1000, currency=currency.NONE, max_labels_count=500, default_qty_type=strategy.cash, commission_type=strategy.commission.percent, commission_value=0.01)

// =============================================================================
// STRATEGY INPUT SETTINGS
// =============================================================================

// ---------------
// Risk Management
// ---------------
swingLength = input.int(15, "Swing High/Low Lookback Length", group='Strategy: Risk Management', tooltip='Stop Loss is calculated by the swing high or low over the previous X candles')
accountRiskPercent = input.float(2, "Account percent loss per trade", step=0.1, group='Strategy: Risk Management', tooltip='Each trade will risk X% of the account balance')
profitFactor = input.float(2, "Profit Factor (R:R Ratio)", step = 0.1, group='Strategy: Risk Management')
useAtrOverride = input.bool(true, "Use Swing High/Low ATR Override", group='Strategy: Risk Management', tooltip='In some cases price may not have a large enough (if any) swing withing previous X candles. Turn this on to use an ATR value when swing high/low is lower than the given ATR value')
atrMultiplier = input.int(1, "Swing High/Low ATR Override Multiplier", group='Strategy: Risk Management')
atrLength = input.int(14, "Swing High/Low ATR Override Length", group='Strategy: Risk Management')

// -----------------
// Strategy Settings
// -----------------
pullbackLength = input.int(5, "Pullback Lookback Length", group='Strategy: Settings', tooltip='Number of candles to consider for a pullback into the moving averages (prerequisite for trade entry)')

// ----------
// Date Range
// ----------
start_year = input.int(title='Start Date', defval=2022, minval=2010, maxval=3000, group='Strategy: Date Range', inline='1')
start_month = input.int(title='', defval=1, group='Strategy: Date Range', inline='1', options = [1, 2, 3, 4, 5, 6, 7, 8, 9, 10, 11, 12])
start_date = input.int(title='', defval=1, group='Strategy: Date Range', inline='1', options = [1, 2, 3, 4, 5, 6, 7, 8, 9, 10, 11, 12, 13, 14, 15, 16, 17, 18, 19, 20, 21, 22, 23, 24, 25, 26, 27, 28, 29, 30, 31])
end_year = input.int(title='End Date', defval=2023, minval=1800, maxval=3000, group='Strategy: Date Range', inline='2')
end_month = input.int(title='', defval=1, group='Strategy: Date Range', inline='2', options = [1, 2, 3, 4, 5, 6, 7, 8, 9, 10, 11, 12])
end_date = input.int(title='', defval=1, group='Strategy: Date Range', inline='2', options = [1, 2, 3, 4, 5, 6, 7, 8, 9, 10, 11, 12, 13, 14, 15, 16, 17, 18, 19, 20, 21, 22, 23, 24, 25, 26, 27, 28, 29, 30, 31])
in_date_range = time >= timestamp(syminfo.timezone, start_year, start_month, start_date, 0, 0) and time < timestamp(syminfo.timezone, end_year, end_month, end_date, 0, 0)

// =============================================================================
// INDICATORS
// =============================================================================

// ---------------
// SuperIchi [LUX]
// ---------------
tenkan_len  = input(9,'Tenkan          ',inline='SuperIchi', group='Indicator: SuperIchi Settings')
tenkan_mult = input(2.,'',inline='SuperIchi', group='Indicator: SuperIchi Settings')

kijun_len   = input(26,'Kijun             ',inline='SuperIchi', group='Indicator: SuperIchi Settings')
kijun_mult  = input(4.,'',inline='SuperIchi', group='Indicator: SuperIchi Settings')

spanB_len   = input(52,'Senkou Span B ',inline='SuperIchi', group='Indicator: SuperIchi Settings')
spanB_mult  = input(6.,'',inline='SuperIchi', group='Indicator: SuperIchi Settings')

offset      = input(26,'Displacement', inline='SuperIchi', group='Indicator: SuperIchi Settings')
//------------------------------------------------------------------------------
avg(src,length,mult)=>
    atr = ta.atr(length)*mult
    up = hl2 + atr
    dn = hl2 - atr
    upper = 0.,lower = 0.
    upper := src[1] < upper[1] ? math.min(up,upper[1]) : up
    lower := src[1] > lower[1] ? math.max(dn,lower[1]) : dn
    
    os = 0,max = 0.,min = 0.
    os := src > upper ? 1 : src < lower ? 0 : os[1]
    spt = os == 1 ? lower : upper
    max := ta.cross(src,spt) ? math.max(src,max[1]) : os == 1 ? math.max(src,max[1]) : spt
    min := ta.cross(src,spt) ? math.min(src,min[1]) : os == 0 ? math.min(src,min[1]) : spt
    math.avg(max,min)
//------------------------------------------------------------------------------
tenkan = avg(close,tenkan_len,tenkan_mult)
kijun = avg(close,kijun_len,kijun_mult)

senkouA = math.avg(kijun,tenkan)
senkouB = avg(close,spanB_len,spanB_mult)
//------------------------------------------------------------------------------
tenkan_css = #2157f3 //blue
kijun_css = #ff5d00 //red

cloud_a = color.new(color.teal,80)
cloud_b = color.new(color.red,80)

chikou_css = #7b1fa2

plot(tenkan,'Tenkan-Sen',tenkan_css)
plot(kijun,'Kijun-Sen',kijun_css)

plot(ta.crossover(tenkan,kijun) ? kijun : na,'Crossover',#2157f3,3,plot.style_circles)
plot(ta.crossunder(tenkan,kijun) ? kijun : na,'Crossunder',#ff5d00,3,plot.style_circles)

A = plot(senkouA,'Senkou Span A',na,offset=offset-1)
B = plot(senkouB,'Senkou Span B',na,offset=offset-1)
fill(A,B,senkouA > senkouB ? cloud_a : cloud_b)

plot(close,'Chikou',chikou_css,offset=-offset+1,display=display.none)


// =============================================================================
// STRATEGY LOGIC
// =============================================================================
plotchar(kijun, "kijun", "", location = location.top)
plotchar(senkouA[offset-1], "senkouA", "", location = location.top)


plotchar(tenkan > kijun, "line above", "", location = location.top)
plotchar(close > tenkan, "price above", "", location = location.top)
plotchar(kijun > senkouA[offset-1], "above cloud", "", location = location.top)
// blue line above red line + price above both lines + both lines above cloud
longSen = tenkan > kijun and close > tenkan and kijun > senkouA[offset-1]
// red line below blue line + price below both lines + both lines below cloud
shortSen = tenkan < kijun and close < tenkan and kijun < senkouA[offset-1]

plotchar(longSen, "longSen", "", location = location.top)
plotchar(shortSen, "shortSen", "", location = location.top)

// Cloud is green
longSenkou = senkouA[offset-1] > senkouB[offset-1]
// Cloud is red
shortSenkou = senkouA[offset-1] < senkouB[offset-1]

// price must have pulled back below sen lines before entry
barsSinceLongPullback = ta.barssince(close < kijun and close < tenkan)
longPullback = barsSinceLongPullback <= pullbackLength
// price must have pulled back above sen lines before entry
barsSinceShortPullback = ta.barssince(close > kijun and close > tenkan)
shortPullback = barsSinceShortPullback <= pullbackLength

// plotchar(lowestClose, "lowestClose", "", location = location.top)
// plotchar(highestClose, "highestClose", "", location = location.top)

inLong = strategy.position_size > 0
inShort = strategy.position_size < 0

longCondition = longSen and longSenkou and longPullback and in_date_range
shortCondition = shortSen and shortSenkou and shortPullback and in_date_range

swingLow = ta.lowest(source=low, length=swingLength)
swingHigh = ta.highest(source=high, length=swingLength)

atr = useAtrOverride ? ta.atr(atrLength) * atrMultiplier : 0
longSl = math.min(close - atr, swingLow)
shortSl = math.max(close + atr, swingHigh)

longStopPercent = math.abs((1 - (longSl / close)) * 100)
shortStopPercent = math.abs((1 - (shortSl / close)) * 100)

longTpPercent = longStopPercent * profitFactor
shortTpPercent = shortStopPercent * profitFactor
longTp = close + (close * (longTpPercent / 100))
shortTp = close - (close * (shortTpPercent / 100))

// Position sizing (default risk 2% per trade)
riskAmt = strategy.equity * accountRiskPercent / 100
longQty = math.abs(riskAmt / longStopPercent * 100) / close
shortQty = math.abs(riskAmt / shortStopPercent * 100) / close

if (longCondition and not inLong)
    strategy.entry("Long", strategy.long, qty=longQty)
    strategy.exit("Long  SL/TP", from_entry="Long", stop=longSl, limit=longTp, alert_message='Long SL Hit')
    buyLabel = label.new(x=bar_index, y=high[1], color=color.green, style=label.style_label_up)
    label.set_y(id=buyLabel, y=low)
    label.set_tooltip(id=buyLabel, tooltip="Risk Amt: " + str.tostring(riskAmt) + "\nQty: " + str.tostring(longQty) + "\nSwing low: " + str.tostring(swingLow) + "\nStop Percent: " + str.tostring(longStopPercent) + "\nTP Percent: " + str.tostring(longTpPercent))

if (shortCondition and not inShort)
    strategy.entry("Short", strategy.short, qty=shortQty)
    strategy.exit("Short  SL/TP", from_entry="Short", stop=shortSl, limit=shortTp, alert_message='Short SL Hit')
    sellLabel = label.new(x=bar_index, y=high[1], color=color.red, style=label.style_label_up)
    label.set_y(id=sellLabel, y=low)
    label.set_tooltip(id=sellLabel, tooltip="Risk Amt: " + str.tostring(riskAmt) + "\nQty: " + str.tostring(shortQty) + "\nSwing high: " + str.tostring(swingHigh) + "\nStop Percent: " + str.tostring(shortStopPercent) + "\nTP Percent: " + str.tostring(shortTpPercent))