EMAC 지수 이동 평균 교차 최적화 전략


생성 날짜: 2023-11-07 15:16:03 마지막으로 수정됨: 2023-11-07 15:16:03
복사: 0 클릭수: 608
avatar of ChaoZhang ChaoZhang
1
집중하다
1621
수행원

EMAC 지수 이동 평균 교차 최적화 전략

개요

EMAC 지수 이동 평균 교차 최적화 전략은 기본 EMAC 전략에 대한 변수 최적화 후의 버전이다. 이 전략은 트렌드 판단, 다중 평균선 필터링 및 스톱 스톱 Exit를 결합하여 중장선 트렌드를 포착하고 트렌드 따를 목적으로 한다.

전략 원칙

  1. 최근 트렌드 방향을 판단: 지난 26주기의 종결 가격 상승과 하락을 계산하여 상승, 하락, 흔들림으로 판단한다.

  2. 다중 평균선 필터: 10주기, 20주기, 34주기 EMA를 계산하고, 50주기 SMA를 통과할 때 구매 신호를 생성한다.

  3. ATR 정지: 엔트리 신호가 발생했을 때, 정지 지점은 엔트리 기둥의 낮은 지점 또는 높은 지점 빼기 2.5 ATR 로 설정된다.

  4. 이동식 스톱: 가격 상승에 따라 서서히 상향으로 이동하는 스톱 라인

  5. 목표 정지: 엔트리 신호가 나타나면 목표 지점을 3ATR 더하여 종료 가격에 설정합니다.

  6. MA 평균선 리조트 스톱로스 Exit: 가격이 10일 EMA를 다시 넘으면 적극적으로 스톱로스를 탈퇴한다.

전략적 이점

  1. 복수의 평균선 필터링은 신호의 신뢰성을 높여서 거짓 돌파구에 의해 오도되는 것을 방지한다.

  2. ATR을 사용하면 시장의 변동성에 따라 합리적인 중지 거리를 설정할 수 있습니다.

  3. 이동식 스톱은 스톱 라인을 점진적으로 상향으로 이동시켜 수익의 일부를 보호한다.

  4. 목표 막기: 합리적인 수익 목표를 설정하고, 탐욕스럽지 않고, 수익을 내뱉는 것을 피하십시오.

  5. MA 회귀 Exit은 트렌드 회귀가 발생했을 때 적시에 퇴출할 수 있도록 해준다.

전략적 위험과 해결 방법

  1. 충격적인 상황에서는 EMA 평균선이 여러 번 교차하게 될 수 있으며, 이는 연속적인 손실의 위험을 초래할 수 있다. EMA 매개 변수를 적절히 확대하거나, MA 골드 포크 필터 조건을 추가하여 이러한 확률을 줄일 수 있다.

  2. ATR 값이 크면, 스톱 라인지가 너무 커져 손실 위험이 증가한다. ATR의 이동 평균을 사용하거나 ATR에 축소 비율 계수를 곱하여 최적화를 고려할 수 있다.

  3. 야간 간격 위험은 고려하지 않는다. 야간 정지 기간의 판단 논리를 추가할 수 있으며, 거래할 수 없는 시간에 신호가 나타나지 않도록 한다.

  4. 대가 상태의 영향을 고려하지 않는다. 대가 트렌드에 대한 판단을 대가 불리한 상황에서의 손실을 줄이기 위해 전략의 핵심 조건 중 하나로 추가할 수 있다.

전략 최적화 방향

  1. 다양한 길이의 EMA 파라미터 조합을 테스트하여 다른 품종에 더 적합한 평균 선 길이를 찾을 수 있다.

  2. ATR의 이동 평균 또는 인수 축소 방법을 테스트하여 스톱디스펜스를 최적화할 수 있다.

  3. 야간 정지 기간 판단 논리를 추가하여 야간 위험을 피할 수 있습니다.

  4. 대시장 동향에 대한 판단에 추가할 수 있으며, 대시장 동향에 불리한 경우의 전환 조건을 설정한다.

  5. 여러 해의 역사 데이터를 역으로 테스트하여 전략이 재검토에서 최적의 안정성을 갖도록 파라미터 조합을 선택할 수 있다.

요약하다

EMAC 지수 이동 평균 십자 최적화 전략은 트렌드 판단, 다중 평평선 필터링 및 동적 스톱 손실을 결합하여 중장선 트렌드를 추적하기 위해 장선을 보유합니다. 원본 버전과 비교하여 파라미터 최적화가 수행되어 더 나은 실장 성과를 얻을 수 있습니다. 그러나 이 전략은 더 많은 시장 상황에 대응하기 위해 더 많은 논리적 판단을 추가하여 더 많은 최적화와 개선이 필요합니다. 실장에서의 위험을 줄이고 전략의 안정성과 수익성을 향상시킵니다.

전략 소스 코드
/*backtest
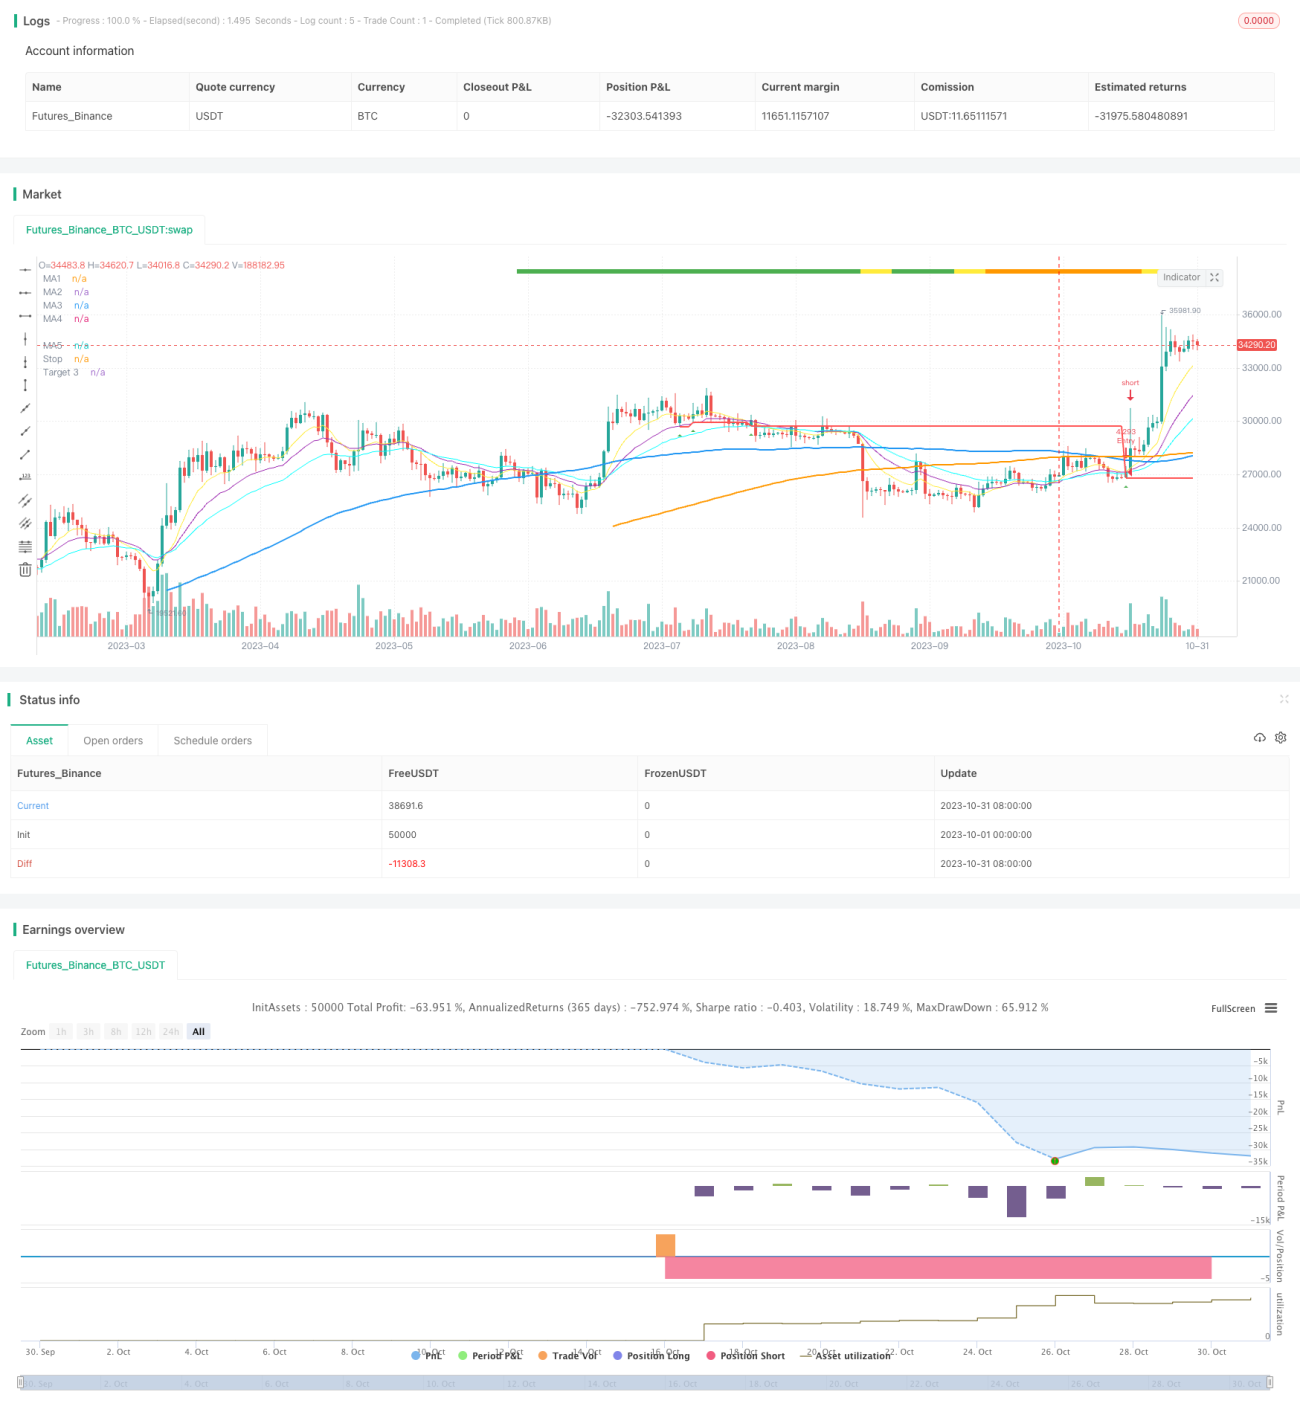
start: 2023-10-01 00:00:00
end: 2023-10-31 23:59:59
period: 1d
basePeriod: 1h
exchanges: [{"eid":"Futures_Binance","currency":"BTC_USDT"}]
*/

//@version=4
//Author = Dustin Drummond https://www.tradingview.com/u/Dustin_D_RLT/
//Strategy based in part on original 10ema Basic Swing Trade Strategy by Matt Delong: https://www.tradingview.com/u/MattDeLong/
//Link to original 10ema Basic Swing Trade Strategy: https://www.tradingview.com/script/8yhGnGCM-10ema-Basic-Swing-Trade-Strategy/
//This is the Original EMAC - Exponential Moving Average Cross Strategy built as a class for reallifetrading dot com and so has all the default settings and has not been optimized
//I would not recomend using this strategy with the default settings and is for educational purposes only
//For the fully optimized version please come back around the same time tomorrow 6/16/21 for the EMAC - Exponential Moving Average Cross - Optimized
//EMAC - Exponential Moving Average Cross
strategy(title="EMAC - Exponential Moving Average Cross", shorttitle = "EMAC", overlay = true, calc_on_every_tick=false, default_qty_value = 100, initial_capital = 100000, default_qty_type = strategy.fixed, pyramiding = 0, process_orders_on_close=true)
//creates a time filter to prevent "too many orders error" and allows user to see Strategy results per year by changing input in settings in Stratey Tester
startYear = input(2015, title="Start Year", minval=1980, step=1)
timeFilter = true
//R Size (Risk Amount)
rStaticOrPercent = input(title="R Static or Percent", defval="Percent", options=["Static", "Percent"])
rSizeStatic = input(2000, title="R Size Static", minval=1, step=100)
rSizePercent = input(3, title="R Size Percent", minval=.01, step=.01)
rSize = rStaticOrPercent == "Static" ? rSizeStatic : rStaticOrPercent == "Percent" ? (rSizePercent * .01 * strategy.equity) : 1
//Recent Trend Indicator "See the standalone version for detailed description"
res = input(title="Trend Timeframe", type=input.resolution, defval="W")
trend = input(26, minval=1, title="# of Bars for Trend")
trendMult = input(15, minval=0, title="Trend Growth %", step=.25) / 100
currentClose = security(syminfo.tickerid, res, close)
pastClose = security(syminfo.tickerid, res, close[trend])
//Trend Indicator
upTrend = (currentClose >= (pastClose * (1 + trendMult)))
downTrend = (currentClose <= (pastClose * (1 - trendMult)))
sidewaysUpTrend = (currentClose < (pastClose * (1 + trendMult)) and (currentClose > pastClose))
sidewaysDownTrend = (currentClose > (pastClose * (1 - trendMult)) and (currentClose < pastClose))
//Plot Trend on Chart
plotshape(upTrend, "Up Trend", style=shape.square, location=location.top, color=color.green, size=size.small)
plotshape(downTrend, "Down Trend", style=shape.square, location=location.top, color=color.red, size=size.small)
plotshape(sidewaysUpTrend, "Sideways Up Trend", style=shape.square, location=location.top, color=color.yellow, size=size.small)
plotshape(sidewaysDownTrend, "Sideways Down Trend", style=shape.square, location=location.top, color=color.orange, size=size.small)
//What trend signals to use in entrySignal
trendRequired = input(title="Trend Required", defval="Red", options=["Green", "Yellow", "Orange", "Red"])
goTrend = trendRequired == "Orange" ? upTrend or sidewaysUpTrend or sidewaysDownTrend : trendRequired == "Yellow" ? upTrend or sidewaysUpTrend : trendRequired == "Green" ? upTrend : trendRequired == "Red" ? upTrend or sidewaysUpTrend or sidewaysDownTrend or downTrend : na
//MAs Inputs Defalt is 10 EMA, 20 EMA, 50 EMA, 100 SMA and 200 SMA
ma1Length = input(10, title="MA1 Period", minval=1, step=1)
ma1Type = input(title="MA1 Type", defval="EMA", options=["SMA", "EMA", "WMA"])
ma2Length = input(20, title="MA2 Period", minval=1, step=1)
ma2Type = input(title="MA2 Type", defval="EMA", options=["SMA", "EMA", "WMA"])
ma3Length = input(34, title="MA3 Period", minval=1, step=1)
ma3Type = input(title="MA3 Type", defval="EMA", options=["SMA", "EMA", "WMA"])
ma4Length = input(100, title="MA4 Period", minval=1, step=1)
ma4Type = input(title="MA4 Type", defval="SMA", options=["SMA", "EMA", "WMA"])
ma5Length = input(200, title="MA5 Period", minval=1, step=1)
ma5Type = input(title="MA5 Type", defval="SMA", options=["SMA", "EMA", "WMA"])
//MAs defined
ma1 = ma1Type == "EMA" ? ema(close, ma1Length) : ma1Type == "SMA" ? sma(close, ma1Length) : wma(close, ma1Length)
ma2 = ma2Type == "EMA" ? ema(close, ma2Length) : ma2Type == "SMA" ? sma(close, ma2Length) : wma(close, ma2Length)
ma3 = ma3Type == "EMA" ? ema(close, ma3Length) : ma3Type == "SMA" ? sma(close, ma3Length) : wma(close, ma3Length)
ma4 = ma4Type == "SMA" ? sma(close, ma4Length) : ma4Type == "EMA" ? ema(close, ma4Length) : wma(close, ma4Length)
ma5 = ma5Type == "SMA" ? sma(close, ma5Length) : ma5Type == "EMA" ? ema(close, ma5Length) : wma(close, ma5Length)
//Plot MAs
plot(ma1, title="MA1", color=color.yellow, linewidth=1, style=plot.style_line)
plot(ma2, title="MA2", color=color.purple, linewidth=1, style=plot.style_line)
plot(ma3, title="MA3", color=#00FFFF, linewidth=1, style=plot.style_line)
plot(ma4, title="MA4", color=color.blue, linewidth=2, style=plot.style_line)
plot(ma5, title="MA5", color=color.orange, linewidth=2, style=plot.style_line)
//Allows user to toggle on/off ma1 > ma2 filter
enableShortMAs = input(title="Enable Short MA Cross Filter", defval="No", options=["Yes", "No"])
shortMACross = enableShortMAs == "Yes" and ma1 > ma2 or enableShortMAs == "No"
//Allows user to toggle on/off ma4 > ma5 filter
enableLongMAs = input(title="Enable Long MA Cross Filter", defval="No", options=["Yes", "No"])
longMACross = enableLongMAs == "Yes" and ma4 >= ma5 or enableLongMAs == "No"
//Entry Signals
entrySignal = (strategy.position_size <= 0 and close[1] < ma1[1] and close > ma1 and close > ma2 and close > ma3 and shortMACross and ma1 > ma3 and longMACross and goTrend)
secondSignal = (strategy.position_size > 0 and close[1] < ma1[1] and close > ma1 and close > ma2 and close > ma3 and shortMACross and ma1 > ma3 and longMACross and goTrend)
plotshape(entrySignal, style=shape.triangleup, location=location.belowbar, color=color.green, size=size.small)
plotshape(secondSignal, style=shape.triangleup, location=location.belowbar, color=color.lime, size=size.small)
//ATR for Stops
atrValue = (atr(14))
//to test ATR enable next line
//plot(atrValue, linewidth=1, color=color.black, style=plot.style_line)
atrMult = input(2.5, minval=.25, step=.25, title="Stop ATR Multiple")
//Only target3Mult is used in current strategy target1 and target2 might be used in the future with pyramiding
//target1Mult = input(1.0, minval=.25, step=.25, title="Targert 1 Multiple")
//target2Mult = input(2.0, minval=.25, step=.25, title="Targert 2 Multiple")
target3Mult = input(3.0, minval=.25, step=.25, title="Target Multiple")
enableAtrStop = input(title="Enable ATR Stops", defval="No", options=["Yes", "No"])
//Intitial Recomended Stop Location
atrStop = entrySignal and ((high - (atrMult * atrValue)) < low) ? (high - (atrMult * atrValue)) : low
//oneAtrStop is used for testing only enable next 2 lines to test
//oneAtrStop = entrySignal ? (high - atrValue) : na
//plot(oneAtrStop, "One ATR Stop", linewidth=2, color=color.orange, style=plot.style_linebr)
initialStop = entrySignal and enableAtrStop == "Yes" ? atrStop : entrySignal ? low : na
//Stops changed to stoploss to hold value for orders the next line is old code "bug"
//plot(initialStop, "Initial Stop", linewidth=2, color=color.red, style=plot.style_linebr)
//Set Initial Stop and hold value "debug code"
stoploss = valuewhen(entrySignal, initialStop, 0)
plot(stoploss, title="Stop", linewidth=2, color=color.red)
enableStops = input(title="Enable Stops", defval="No", options=["Yes", "No"])
yesStops = enableStops == "Yes" ? 1 : enableStops == "No" ? 0 : na
//Calculate size of trade based on R Size
//Original buggy code: 
//positionSize = (rSize/(close - initialStop))
//Added a minimum order size of 1 "debug code"
positionSize = (rSize/(close - initialStop)) > 1 ? (rSize/(close - initialStop)) : 1
//Targets
//Enable or Disable Targets
enableTargets = input(title="Enable Targets", defval="No", options=["Yes", "No"])
yesTargets = enableTargets == "Yes" ? 1 : enableTargets == "No" ? 0 : na
//Only target3 is used in current strategy target1 and target2 might be used in the future with pyramiding
//target1 = entrySignal ? (close + ((close - initialStop) * target1Mult)) : na
//target2 = entrySignal ? (close + ((close - initialStop) * target2Mult)) : na
target3 = entrySignal ? (close + ((close - initialStop) * target3Mult)) : na
//plot(target1, "Target 1", linewidth=2, color=color.green, style=plot.style_linebr)
//plot(target2, "Target 2", linewidth=2, color=color.green, style=plot.style_linebr)
plot(target3, "Target 3", linewidth=2, color=color.green, style=plot.style_linebr)
//Set Target and hold value "debug code"
t3 = valuewhen(entrySignal, target3, 0)
//To test t3 and see plot enable next line
//plot(t3, title="Target", linewidth=2, color=color.green)
//MA1 Cross Exit
enableEarlyExit = input(title="Enable Early Exit", defval="Yes", options=["Yes", "No"])
earlyExit = enableEarlyExit == "Yes" ? 1 : enableEarlyExit == "No" ? 0 : na
ma1CrossExit = strategy.position_size > 0 and close < ma1
//Entry Order
strategy.order("Entry", long = true, qty = positionSize, when = (strategy.position_size <= 0 and entrySignal and timeFilter))
//Early Exit Order
strategy.close_all(when = ma1CrossExit and timeFilter and earlyExit, comment = "MA1 Cross Exit")
//Stop and Target Orders
//strategy.cancel orders are needed to prevent bug with Early Exit Order
strategy.order("Stop Loss", false, qty = strategy.position_size, stop=stoploss, oca_name="Exit",  when = timeFilter and yesStops, comment = "Stop Loss")
strategy.cancel("Stop Loss", when = ma1CrossExit and timeFilter and earlyExit)
strategy.order("Target", false, qty = strategy.position_size, limit=t3, oca_name="Exit",  when = timeFilter and yesTargets, comment = "Target")
strategy.cancel("Target", when = ma1CrossExit and timeFilter and earlyExit)