RSI 이동 평균 교차 전략

개요
RSI 평행선 교차 전략은 암호화폐 거래에 적용되는 전략이다. 이 전략은 이동 평균을 RSI 지표에 적용하고 RSI와 이동 평균의 교차 상황에 따라 구매 및 판매 신호를 발송한다.
전략 원칙
이 전략은 먼저 RSI 지표를 계산한다. RSI 지표는 일정 시간 동안의 하락 하락 변화를 기반으로 가격의 강점을 반영한다. RSI가 70보다 큰 것은 초고 구매 지역이며, 30보다 작은 것은 초판 판매 지역이다.
이 전략은 RSI 지표에 기반한 이동 평균을 적용한다. 이동 평균은 무작위적인 변동을 필터링하여 트렌드 방향을 판단한다. 여기에 10 주기의 RSI 이동 평균이 설정되어 있다.
RSI 상에서 이동 평균을 통과하면 구매 신호로 간주되며, RSI 아래에서 이동 평균을 통과하면 판매 신호로 간주됩니다. 이 두 신호에 따라 거래합니다.
코드에서, 먼저 length 주기의 RSI 지표를 계산한다. 그리고 10 주기의 RSI의 이동 평균 ma를 계산한다. ma가 rsi를 통과하면 구매; ma가 rsi를 통과하면 판매.
또한, rsi, ma의 선형 도형을 그리고 rsi-ma의 기둥 도형을 그렸다. rsi=70, rsi=30의 경계선을 그렸다. 그리고 매매할 때, 도표에 해당하는 신호 화살을 표시했다.
전략적 강점 분석
- RSI 지표는 과매매를 판단할 수 있고, 이동 평균은 무작위 변동을 필터링할 수 있으며, 둘을 결합하면 트렌드 전환점을 발견할 수 있다.
- RSI 평균선 교차는 비교적 성숙한 거래 전략으로, 일부 가짜 신호를 필터링 할 수 있습니다.
- 이 전략 코드는 간단하고 명확하며 이해하기 쉽다. 지도 기능은 완전하고 거래 신호를 명확하게 관찰할 수 있다.
- 이 전략은 트렌드가 더 뚜렷한 암호화폐에 적용되며 효과가 더 좋다.
전략적 위험 분석
- RSI와 이동 평균이 사용하는 주기적 파라미터는 부적절하며, 잘못된 신호가 너무 많이 발생될 수 있다.
- 단순히 지표의 교차만을 의존하는 것은 완전히 교차를 피할 수 없습니다. 트렌드 분석과 결합해야합니다.
- 거래비용은 수익에 영향을 미칩니다. 포지션 관리를 최적화해야 합니다.
- 암호화폐 시장의 큰 변동으로 인해 상쇄상황의 위험성을 경계해야 합니다.
리스크에 맞게, 지표 효과를 최적화하기 위해 파라미터를 조정할 수 있으며, 포지션을 적절히 줄이고, 스톱 라인을 설정하고, 트렌드 분석과 함께 신호를 필터링 할 수 있다.
전략 최적화 방향
- RSI와 평균선의 최적의 조합을 연구할 수 있습니다.
- 트렌드가 강할 때 포지션을 늘릴 수 있고, 트렌드가 불분명할 때 포지션을 줄일 수 있습니다.
- 동적 상쇄를 설정하고 트렌드를 추적 할 수 있습니다.
- 다른 지표와 RSI를 조합하여 새로운 거래 신호를 만들 수 있습니다.
- 이 전략에 기반한 기계 학습 모델을 탐색하여 전략의 승률을 높일 수 있습니다.
요약하다
RSI 평행선 교차 전략은 트렌드 지표와 필터 지표의 장점을 결합하여 비교적 성숙하고 신뢰할 수 있습니다. 이 전략의 논리는 간단하고 이해하기 쉽고, 코드 구현도 완전하며, 전반적으로 더 나은 암호화폐 거래 전략입니다. 그러나 모든 전략에는 최적화가 필요한 곳이 있으며, 지속적인 테스트와 조정이 필요하며, 더 나은 전략 효과를 얻기 위해 트렌드 판단에 보조됩니다.
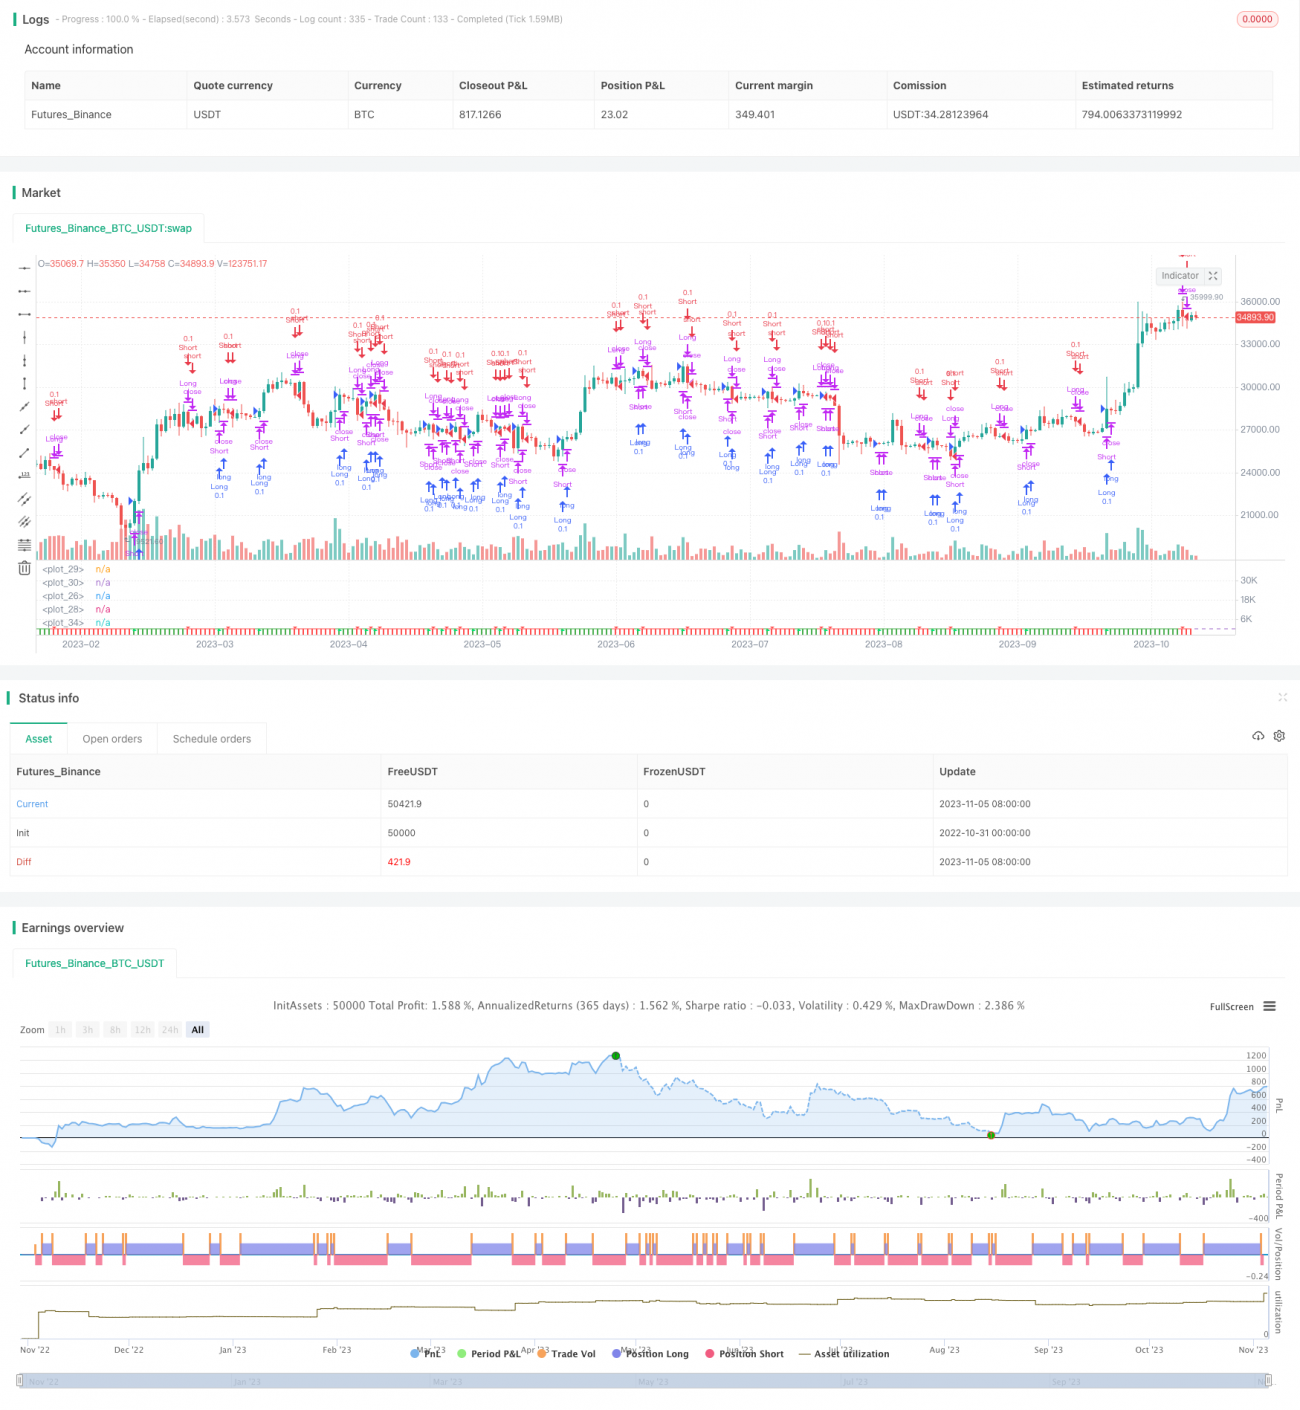
/*backtest
start: 2022-10-31 00:00:00
end: 2023-11-06 00:00:00
period: 1d
basePeriod: 1h
exchanges: [{"eid":"Futures_Binance","currency":"BTC_USDT"}]
*/

//@version=4
strategy("RSI w MA Strategy", shorttitle="RSI w MA Strategy", overlay=false, initial_capital=10000, currency='USD',process_orders_on_close=true)

//TIME FRAME AND BACKGROUND CONTROL/////////////////////////////////////////////- 1