
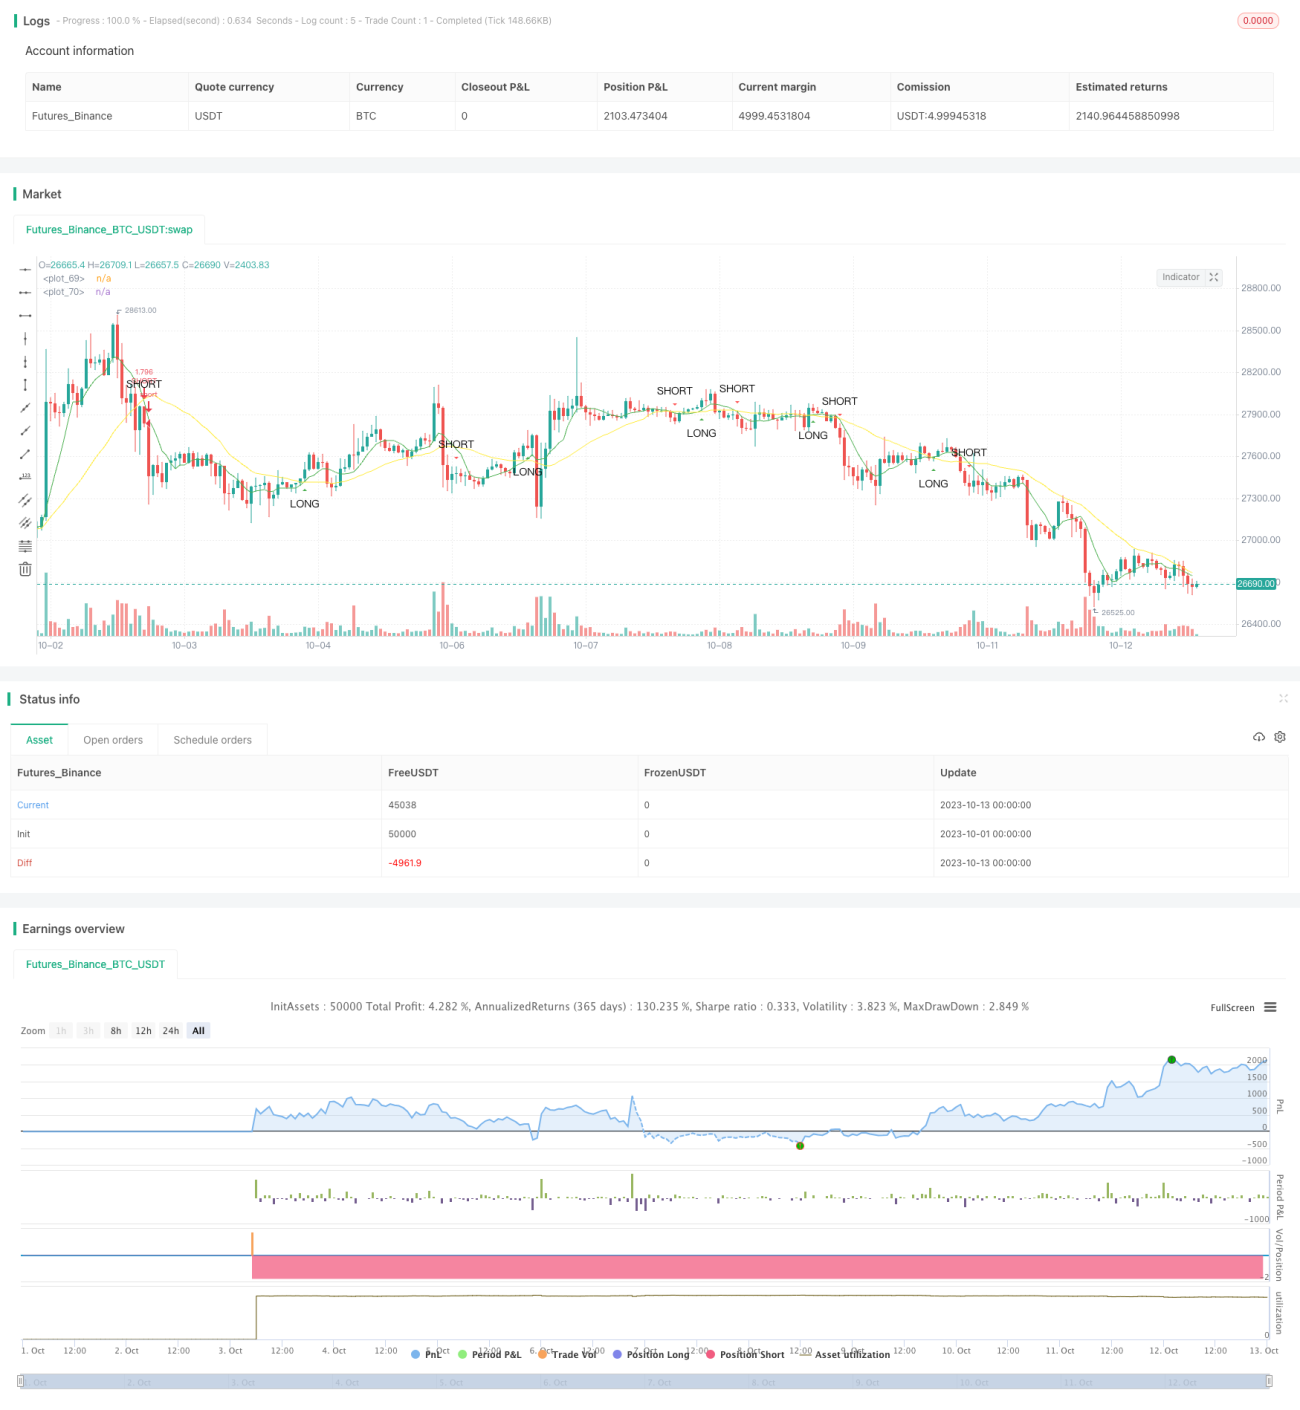
이 전략은 빠른 이동 평균과 느린 이동 평균의 교차 원리에 기초하여 거래 신호를 생성한다. 빠른 이동 평균이 아래에서 느린 이동 평균을 통과하면 구매 신호를 생성한다. 빠른 이동 평균이 위에서 아래에서 느린 이동 평균을 통과하면 판매 신호를 생성한다.
이 전략은 sma 함수를 사용하여 빠른 이동 평균과 느린 이동 평균을 계산한다. fast_SMA는 빠른 이동 평균이며, 주기 길이는 fast_SMA_input; slow_SMA는 느린 이동 평균이며, 주기 길이는 slow_SMA_input이다.
전략은 크로스 및 크로스 언더 함수를 사용하여 빠른 이동 평균과 느린 이동 평균의 교차 상황을 판단합니다. 빠른 이동 평균 위에 느린 이동 평균을 통과하면 LONG 변수가 참이며 구매 신호를 발생시킵니다. 빠른 이동 평균 아래에 느린 이동 평균을 통과하면 SHORT 변수가 참이며 판매 신호를 발생시킵니다.
이 전략은 다음과 같은 장점을 가지고 있습니다.
이 전략에는 다음과 같은 위험도 있습니다.
위험 관리 방법:
이 전략은 다음과 같은 측면에서 최적화될 수 있습니다.
이 전략은 이동 평균의 장점을 활용하여 간단하고 효과적으로 거래 신호를 생성한다. 약간의 위험이 있지만, 매개 변수 최적화, 필터링 조건을 추가하는 등의 방법으로 개선할 수 있다. 이동 평균 교차 전략은 더 많은 연구와 응용이 가치가 있다.
/*backtest
start: 2023-10-01 00:00:00
end: 2023-10-13 00:00:59
period: 1h
basePeriod: 15m
exchanges: [{"eid":"Futures_Binance","currency":"BTC_USDT"}]
*/
//@author Jacques Grobler
//
// SIMPLE CROSS OVER BOT
// =====================
//
// This is a simple example of how to set up a strategy to go long or short
// If you make any modifications or have any suggestions, let me know
// When using this script, every section marked back testing should be
// uncommented in order to use for back testing, same goes for using the script portion
///////////////////////////////////////////////////////////////////////////////////////
//// INTRO
//// -----
// BACKTESTING
//@version=4
strategy(title="SimpleCrossOver_Bot_V1_Backtester", overlay=true, default_qty_type=strategy.percent_of_equity, default_qty_value=100, pyramiding=0, commission_type=strategy.commission.percent, commission_value=0.1)
// SIGNALS
//study(title="SimpleCrossOver_Bot_V1_Signals", overlay = true)
///////////////////////////////////////////////////////////////////////////////////////
//// INPUTS
//// ------
// BACKTESTING
dateSart_Year = input(2018, title="Start Year", minval=2000)
dateSart_Month = input(1, title="Start Month", minval=1, maxval=12)
dateSart_Day = input(1, title="Start Day", minval=1, maxval=31)
dateEnd_Year = input(2019, title="End Year", minval=2000)
dateEnd_Month = input(1, title="End Month", minval=1, maxval=12)
dateEnd_Day = input(1, title="End Day", minval=1, maxval=31)
// BACKTESTING AND SIGNALS
fast_SMA_input = input(7, title="SMA Fast")
slow_SMA_input = input(25, title="SMA Slow")
///////////////////////////////////////////////////////////////////////////////////////
//// INDICATORS
//// ----------
fast_SMA = sma(close, fast_SMA_input)
slow_SMA = sma(close, slow_SMA_input)
///////////////////////////////////////////////////////////////////////////////////////
//// STRATEGY
//// --------
LONG = cross(fast_SMA, slow_SMA) and fast_SMA > slow_SMA
stratLONG() => crossover(fast_SMA, slow_SMA)
SHORT = cross(fast_SMA, slow_SMA) and fast_SMA < slow_SMA
stratSHORT() => crossunder(fast_SMA, slow_SMA)
///////////////////////////////////////////////////////////////////////////////////////
//// TRIGGERS
//// --------
// BACKTESTING
testPeriodStart = timestamp(dateSart_Year, dateSart_Month, dateSart_Day, 0, 0)
testPeriodStop = timestamp(dateEnd_Year, dateEnd_Month, dateEnd_Day, 0, 0)
timecondition = true
strategy.entry(id="LONG", long = true, when=timecondition and stratLONG())
strategy.entry(id="SHORT", long = false, when=timecondition and stratSHORT())
// SIGNALS
//alertcondition(LONG, title="LONG")
//alertcondition(SHORT, title="SHORT")
///////////////////////////////////////////////////////////////////////////////////////
//// PLOTS
//// -----
// BACKTESTING AND SIGNALS
plot(fast_SMA, color=green, linewidth=1)
plot(slow_SMA, color=yellow, linewidth=1)
plotshape(LONG, title="LONG", style=shape.triangleup, text="LONG", location=location.belowbar, size=size.small, color=green)
plotshape(SHORT, title="SHORT", style=shape.triangledown, text="SHORT", location=location.abovebar, size=size.small, color=red)