다중 이동 평균 갭 양방향 거래 전략


생성 날짜: 2023-11-15 16:22:07 마지막으로 수정됨: 2023-11-15 16:22:07
복사: 0 클릭수: 822
avatar of ChaoZhang ChaoZhang
1
집중하다
1617
수행원

다중 이동 평균 갭 양방향 거래 전략

개요

이 전략은 윌리엄스 신 고, 신 저 지표를 사용하여 빈 반전 신호를 식별하고, 다중 평균선과 함께 균열 거래를 수행하고, RSI 지표가 가짜 신호를 필터링하여 효율적인 쌍방향 거래를 수행합니다.

전략 원칙

  1. 윌리엄스 신고음 신저음 지표는 일정 주기 동안의 최고 가격과 최저 가격 판단으로 턴 포인트가 발생하여 구매 및 판매 신호를 발송한다.

  2. 20일, 50일, 100일 평균선은 다중 평균선을 구성하며, 가격이 그 중 두 개의 평균선을 뚫었을 때 거래 신호를 냅니다.

  3. RSI 지표는 불확정 신호를 필터링하기 위해 오버 바이 오버 셀 영역을 판단합니다.

  4. 이 전략은 Williams 지수 신호와 RSI 필터링을 결합하여 가격의 두 중간선을 돌파하는 것을 판단하여 안정적인 구매/판매 신호를 생성합니다.

  5. 입시 판단: 단기 평균선이 아래로 올라간다면 중기 평균선이 깨지고, 윌리엄스의 새로운 낮은 것과 RSI 낮은 신호가 동시에 나타났을 때, 더 많은 것을하십시오. 단기 평균선이 위로 내려간다면 중기 긴 평균선이 깨지고, 윌리엄스의 새로운 높은 것과 RSI 높은 신호가 동시에 나타났을 때, 공백을하십시오.

  6. 스피드 스피드: 고정 비율 스피드 스피드 스피드를 설정한다.

전략적 이점

  1. 윌리엄스 지표는 역전 신호를 식별하는 핵심 지지 저항을 정확하게 판단할 수 있다.

  2. 다중평균선 돌파 판단, 단일평균선 진동으로 인해 잘못된 신호를 방지한다.

  3. RSI 지표는 부정확한 신호를 필터링하여 정확한 진입 시기를 제공합니다.

  4. 고정 손해 방지 시스템이 위험을 통제하여 수익과 손실을 더 명확하게합니다.

  5. 반전 지표와 트렌드 지표의 이중 확인을 결합하여 거래 신호를 더욱 정확하고 신뢰할 수 있게 한다.

전략적 위험

  1. 거래 품종 선택이 부적절하여 다른 품종의 매개 변수를 조정해야 합니다.

  2. 주기적 선택이 불합리하여, 다른 주기들에 대한 변수를 조정할 필요가 있다.

  3. 고정 스톱은 시장의 변화에 따라 조정할 수 없으며, 너무 일찍 스톱을 중지하거나 충분히 스톱을 중지하지 않을 수 있다.

  4. 평균선 흔들림이 잘못된 신호를 유발할 수 있다.

  5. 지표가 분산될 때 신호가 지연된다.

전략 최적화 방향

  1. 다른 거래 품종에 따라 동적으로 최적화 파라미터.

  2. 자동으로 조정되는 손해 차단 시스템을 추가하여 손실을 합리적으로 만듭니다.

  3. MACD, Stochastic 등과 같은 더 많은 지표 필터를 추가하여 잘못된 신호를 줄이십시오.

  4. 기계 학습 알고리즘을 추가하여 최적의 거래 시간을 자동으로 식별합니다.

  5. 트렌드를 판단하는 지표와 함께 트렌드 상황을 파악합니다.

요약하다

이 전략은 윌리엄스 지표, 평균 지표 및 RSI 지표와 같은 여러 가지 기술적 분석 도구를 통합하여, 두 번의 확인을 통해 잘못된 신호를 줄이고, 역전 기회를 효과적으로 포착하고, 고정된 스톱 스톱 제어 위험과 함께, 전체적으로 볼 때 신뢰할 수있는 실용적인 쌍방향 거래 전략입니다. 다음 단계는 변수 최적화, 스톱 스톱 최적화 및 모델 통합과 같은 방법으로 전략 효과를 더욱 강화합니다.
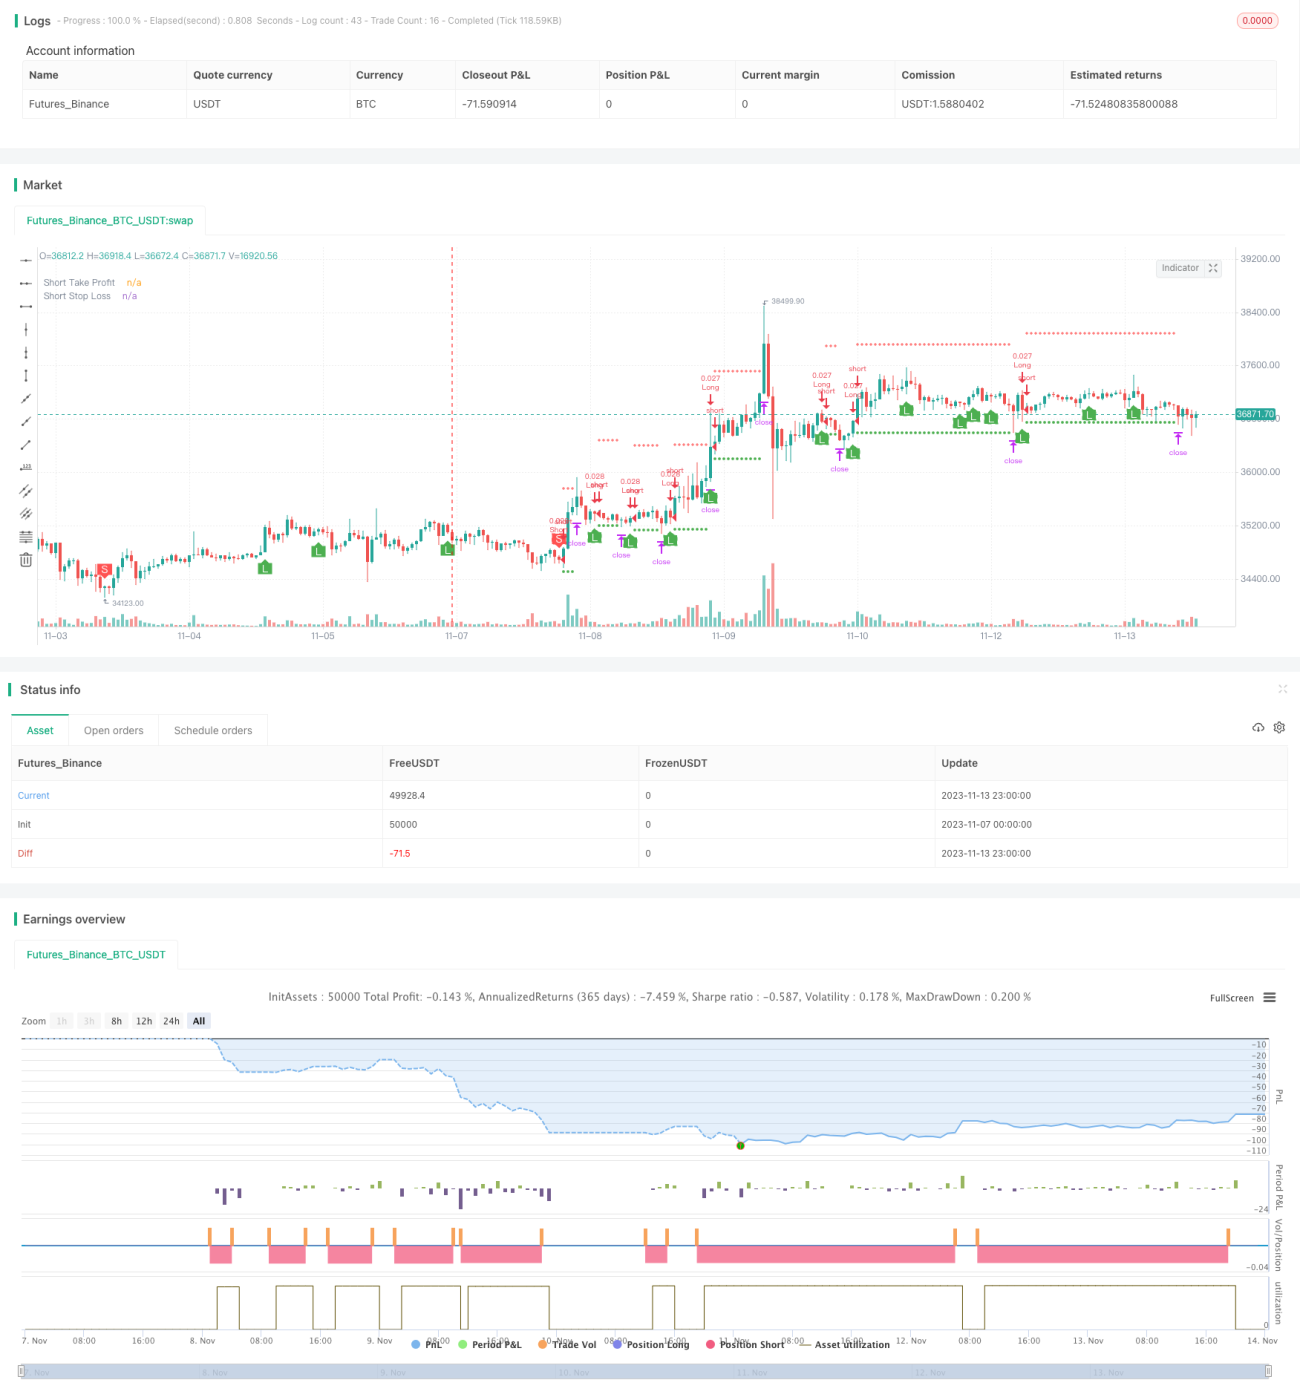
전략 소스 코드
/*backtest
start: 2023-11-07 00:00:00
end: 2023-11-14 00:00:00
period: 1h
basePeriod: 15m
exchanges: [{"eid":"Futures_Binance","currency":"BTC_USDT"}]
*/

// This source code is subject to the terms of the Mozilla Public License 2.0 at https://mozilla.org/MPL/2.0/
// © B_L_A_C_K_S_C_O_R_P_I_O_N
// v 1.1

//@version=4
strategy("Williams Fractals Strategy by ȼhąţhµяąɲǥą", overlay=true, default_qty_type=strategy.cash, default_qty_value=1000, currency='USD')

// *************Appearance*************
theme = input(type=input.string, defval="dark", options=["light","dark"], group="Appearance")
show_fractals = input(false, "Show Fractals", group="Appearance")
show_ema = input(false, "Show EMAs", group="Appearance")

// *************colors*************
color_green = color.green
color_red = color.red
color_yellow = color.yellow
color_orange = color.orange
color_blue = color.blue
color_white = color.white

// *************WF*************
// Define "n" as the number of periods and keep a minimum value of 2 for error handling.
n = input(title="Fractal Periods", defval=2, minval=2, type=input.integer, group="Williams Fractals")

// UpFractal
bool upflagDownFrontier = true
bool upflagUpFrontier0 = true
bool upflagUpFrontier1 = true
bool upflagUpFrontier2 = true
bool upflagUpFrontier3 = true
bool upflagUpFrontier4 = true

for i = 1 to n
    upflagDownFrontier := upflagDownFrontier and (high[n-i] < high[n])
    upflagUpFrontier0 := upflagUpFrontier0 and (high[n+i] < high[n])
    upflagUpFrontier1 := upflagUpFrontier1 and (high[n+1] <= high[n] and high[n+i + 1] < high[n])
    upflagUpFrontier2 := upflagUpFrontier2 and (high[n+1] <= high[n] and high[n+2] <= high[n] and high[n+i + 2] < high[n])
    upflagUpFrontier3 := upflagUpFrontier3 and (high[n+1] <= high[n] and high[n+2] <= high[n] and high[n+3] <= high[n] and high[n+i + 3] < high[n])
    upflagUpFrontier4 := upflagUpFrontier4 and (high[n+1] <= high[n] and high[n+2] <= high[n] and high[n+3] <= high[n] and high[n+4] <= high[n] and high[n+i + 4] < high[n])
flagUpFrontier = upflagUpFrontier0 or upflagUpFrontier1 or upflagUpFrontier2 or upflagUpFrontier3 or upflagUpFrontier4

upFractal = (upflagDownFrontier and flagUpFrontier)

// downFractal
bool downflagDownFrontier = true
bool downflagUpFrontier0 = true
bool downflagUpFrontier1 = true
bool downflagUpFrontier2 = true
bool downflagUpFrontier3 = true
bool downflagUpFrontier4 = true

for i = 1 to n
    downflagDownFrontier := downflagDownFrontier and (low[n-i] > low[n])
    downflagUpFrontier0 := downflagUpFrontier0 and (low[n+i] > low[n])
    downflagUpFrontier1 := downflagUpFrontier1 and (low[n+1] >= low[n] and low[n+i + 1] > low[n])
    downflagUpFrontier2 := downflagUpFrontier2 and (low[n+1] >= low[n] and low[n+2] >= low[n] and low[n+i + 2] > low[n])
    downflagUpFrontier3 := downflagUpFrontier3 and (low[n+1] >= low[n] and low[n+2] >= low[n] and low[n+3] >= low[n] and low[n+i + 3] > low[n])
    downflagUpFrontier4 := downflagUpFrontier4 and (low[n+1] >= low[n] and low[n+2] >= low[n] and low[n+3] >= low[n] and low[n+4] >= low[n] and low[n+i + 4] > low[n])
flagDownFrontier = downflagUpFrontier0 or downflagUpFrontier1 or downflagUpFrontier2 or downflagUpFrontier3 or downflagUpFrontier4

downFractal = (downflagDownFrontier and flagDownFrontier)

plotshape(downFractal and show_fractals, style=shape.triangleup, location=location.belowbar, offset=-n, color=color_green)
plotshape(upFractal and show_fractals, style=shape.triangledown, location=location.abovebar, offset=-n, color=color_red)

// *************EMA*************
len_a = input(20, minval=1, title="EMA Length A", group="EMA")
src_a = input(close, title="EMA Source A", group="EMA")
offset_a = input(title="EMA Offset A", type=input.integer, defval=0, minval=-500, maxval=500, group="EMA")
out_a = ema(src_a, len_a)
plot(show_ema ? out_a : na, title="EMA A", color=color_green, offset=offset_a)

len_b = input(50, minval=1, title="EMA Length B", group="EMA")
src_b = input(close, title="EMA Source B", group="EMA")
offset_b = input(title="EMA Offset B", type=input.integer, defval=0, minval=-500, maxval=500, group="EMA")
out_b = ema(src_b, len_b)
ema_b_color = (theme == "dark") ? color_yellow : color_orange
plot(show_ema ? out_b : na, title="EMA B", color=ema_b_color, offset=offset_b)

len_c = input(100, minval=1, title="EMA Length C", group="EMA")
src_c = input(close, title="EMA Source C", group="EMA")
offset_c = input(title="EMA Offset C", type=input.integer, defval=0, minval=-500, maxval=500, group="EMA")
out_c = ema(src_c, len_c)
ema_c_color = (theme == "dark") ? color_white : color_blue
plot(show_ema ? out_c : na, title="EMA C", color=ema_c_color, offset=offset_c)

// *************RSI*************
rsi_len = input(14, minval=1, title="RSI Length", group="RSI")
rsi_src = input(close, "RSI Source", type = input.source, group="RSI")
up = rma(max(change(rsi_src), 0), rsi_len)
down = rma(-min(change(rsi_src), 0), rsi_len)
rsi = down == 0 ? 100 : up == 0 ? 0 : 100 - (100 / (1 + up / down))

// *************Calculation*************
long = (out_a > out_b) and (out_a > out_c) and downFractal and low[2] > out_c and rsi[2] < rsi
short = (out_a < out_b) and (out_a < out_c) and upFractal and high[2] < out_c and rsi[2] > rsi

plotshape(long, style=shape.labelup, color=color_green, location=location.belowbar, title="long label", text= "L", textcolor=color_white)
plotshape(short, style=shape.labeldown, color=color_red, location=location.abovebar, title="short label", text= "S", textcolor=color_white)

// *************End of Signals calculation*************

// Make input options that configure backtest date range
startDate = input(title="Start Date", type=input.integer,
     defval=1, minval=1, maxval=31, group="Orders")
startMonth = input(title="Start Month", type=input.integer,
     defval=1, minval=1, maxval=12, group="Orders")
startYear = input(title="Start Year", type=input.integer,
     defval=2018, minval=1800, maxval=2100, group="Orders")

endDate = input(title="End Date", type=input.integer,
     defval=1, minval=1, maxval=31, group="Orders")
endMonth = input(title="End Month", type=input.integer,
     defval=12, minval=1, maxval=12, group="Orders")
endYear = input(title="End Year", type=input.integer,
     defval=2022, minval=1800, maxval=2100, group="Orders")

// Look if the close time of the current bar
// falls inside the date range
inDateRange =  true

// Make inputs that set the take profit % (optional)
longProfitPerc = input(title="Long Take Profit (%)",
     type=input.float, minval=0.0, step=0.1, defval=0.5, group="Orders") * 0.01

shortProfitPerc = input(title="Short Take Profit (%)",
     type=input.float, minval=0.0, step=0.1, defval=0.5, group="Orders") * 0.01

// Figure out take profit price
longExitPrice  = strategy.position_avg_price * (1 + longProfitPerc)
shortExitPrice = strategy.position_avg_price * (1 - shortProfitPerc)

// Plot take profit values for confirmation
plot(series=(strategy.position_size > 0) ? longExitPrice : na,
     color=color_green, style=plot.style_circles,
     linewidth=1, title="Long Take Profit")
plot(series=(strategy.position_size < 0) ? shortExitPrice : na,
     color=color_green, style=plot.style_circles,
     linewidth=1, title="Short Take Profit")

// Submit entry orders
if (inDateRange and long and strategy.opentrades == 0)
    strategy.entry(id="Long", long=true)

if (inDateRange and short and strategy.opentrades == 0)
    strategy.entry(id="Short", long=false)

// Submit exit orders based on take profit price
// if (strategy.position_size > 0)
//     strategy.exit(id="LTP", limit=longExitPrice)

// if (strategy.position_size < 0)
//     strategy.exit(id="STP", limit=shortExitPrice)
    
// Set stop loss level with input options (optional)
longLossPerc = input(title="Long Stop Loss (%)",
     type=input.float, minval=0.0, step=0.1, defval=3.1, group="Orders") * 0.01

shortLossPerc = input(title="Short Stop Loss (%)",
     type=input.float, minval=0.0, step=0.1, defval=3.1, group="Orders") * 0.01

// Determine stop loss price
longStopPrice  = strategy.position_avg_price * (1 - longLossPerc)
shortStopPrice = strategy.position_avg_price * (1 + shortLossPerc)

// Plot stop loss values for confirmation
plot(series=(strategy.position_size > 0) ? longStopPrice : na,
     color=color_red, style=plot.style_cross,
     linewidth=1, title="Long Stop Loss")
plot(series=(strategy.position_size < 0) ? shortStopPrice : na,
     color=color_red, style=plot.style_cross,
     linewidth=1, title="Short Stop Loss")

// Submit exit orders based on calculated stop loss price
if (strategy.position_size > 0)
    strategy.exit(id="ExL",limit=longExitPrice, stop=longStopPrice)

if (strategy.position_size < 0)
    strategy.exit(id="ExS", limit=shortExitPrice, stop=shortStopPrice)

// Exit open market position when date range ends
if (not inDateRange)
    strategy.close_all()