
이 전략은 쌍 RSI 지표를 사용하여 장단 쌍방향 거래를 하고, 동시에 평선 시스템과 결합하여 트렌드 방향을 판단하는 쌍 RSI 양적 전략에 속한다. 전략은 먼저 RSI 지표를 사용하여 다空 신호를 판단하고, 다음으로 평선 결정하는 트렌드 방향을 결정하여 더 다空를 결정한다. 전형적인 경향 추적 전략에 속한다.
이중 RSI 수량화 전략은 거래 신호 판단을 위해 주로 이중 시간 주기 RSI 지표를 사용합니다. 전략은 먼저 두 개의 RSI 파라미터를 설정합니다. 더 긴 주기는 주요 거래 판단으로, 더 짧은 주기는 보조 필터로 사용됩니다. 더 긴 주기 RSI 라인 아래에서 판매 라인을 깨면 다중 신호가 발생하며, 짧은 주기 RSI 라인 상에서 구매 라인을 깨면 마이너스 신호가 발생하여 쌍 RSI 지표의 긴 짧은 교차 거래 기회가 발생합니다.
가짜 신호를 필터링하기 위해, 전략은 SMA와 EMA 평균을 도입하여 트렌드를 판단한다. 단기 SMA 라인에서 장기 EMA 라인을 통과 할 때만 RSI를 다중 신호로 고려하고, 단기 SMA 라인 아래에서 장기 EMA 라인을 통과 할 때만 RSI를 공백 신호로 고려하여 쌍 RSI 신호가 트렌드 방향과 일치하고, 역 트렌드 거래를 피한다.
또한, 전략은 스톱로스 스톱 논리를 설정한다. 포지션을 개시한 후 동시에 두 개의 다른 수의 스톱 카드를 내며 스톱로스 위치를 설정한다.
이중 RSI 수량화 전략은 다음과 같은 장점이 있습니다.
이중 시간 주기 RSI 지표는 다공계 신호를 더 정확하게 판단할 수 있다. 장단기 RSI 교차 조합은 일부 가짜 신호를 필터링하여 신호 품질을 향상시킬 수 있다.
평선 시스템은 큰 트렌드 방향을 판단하는데 도움을 주고, 역 트렌드 거래를 피하고, 대부분의 노이즈 거래를 필터링하여 승률을 높일 수 있다.
유연한 스톱 스톱 손실 메커니즘, 다양한 스톱 설정으로 더 높은 수익을 얻을 수 있으며, 위험을 제어하기 위해 스톱 스톱을 사용할 수 있습니다.
전략적 거래 논리는 간단하고 명확하며, 이해하기 쉽고 최적화 할 수 있으며, 양적 거래자가 배울 수 있습니다.
이 RSI 양자 전략은 장점이 있지만 다음과 같은 위험도 있습니다.
RSI 지표 자체는 흔들림과 트렌드 반전의 판단에 효과가 없으며, 전략은 이러한 시장에서 거래 효과가 좋지 않을 수 있습니다.
평균선 시스템은 작은 범위의 소음을 필터링 할 수 있지만, 중간 주기 트렌드 변화에 대한 판단 효과는 좋지 않으며, 트렌드 전환점을 놓칠 수 있습니다.
정지 손실 설정이 잘못되면 정지 손실이 너무 넓거나 정지 손실이 너무 작아져서 전략의 효과가 떨어질 수 있습니다.
대규모의 상장 과잉은 손실의 확장을 초래할 수 있으며, 포지션 규모를 통제해야 한다.
위와 같은 위험을 위해, RSI 파라미터를 조정하여 더 고급 트렌드 및 역전 지표를 도입하고, 스톱 스톱 손실 논리를 최적화하고, 포지션을 제어하여 위험을 줄일 수 있습니다.
이중 RSI의 양적 전략은 다음과 같은 방향에서 더욱 최적화될 수 있다:
다양한 변수 조합을 시도하고, RSI 주기 변수를 최적화하여, 최적의 장기 단기 RSI 지표 조합을 찾습니다.
다양한 평균선 지표를 테스트하고 MACD와 같은 지표를 도입하여 추세와 역전 기회를 판단합니다.
스톱 스톱 손실 전략을 최적화하고, 스톱 스톱 손실을 더 유연하게 만들기 위해 스톱 스톱 손실을 추적하거나 이동 스톱 스톱을 설정하십시오.
포지션 컨트롤 모듈을 추가하여, 대주기 트렌드의 다양한 단계에서 더 많은 코카이 포지션을 제어한다.
기계학습 모형을 추가하여 입력과 출구의 정확성을 향상시킵니다.
이 경우, 거래의 종류와 기간에 대한 최적화를 위해 재검토를 수행합니다.
듀얼 RSI 양자 전략은 전체적으로 전형적인 트렌드 추적 전략이다. 이 쌍의 RSI 지표 판단 거래 신호와 일률 시스템 필터링 잡음의 전략 아이디어는 매우 고전적이고 실용적이다. 전략에도 약간의 개선의 여지가 있지만, 전체적인 운영 논리는 명확하고 이해하기 쉽고 최적화된다.
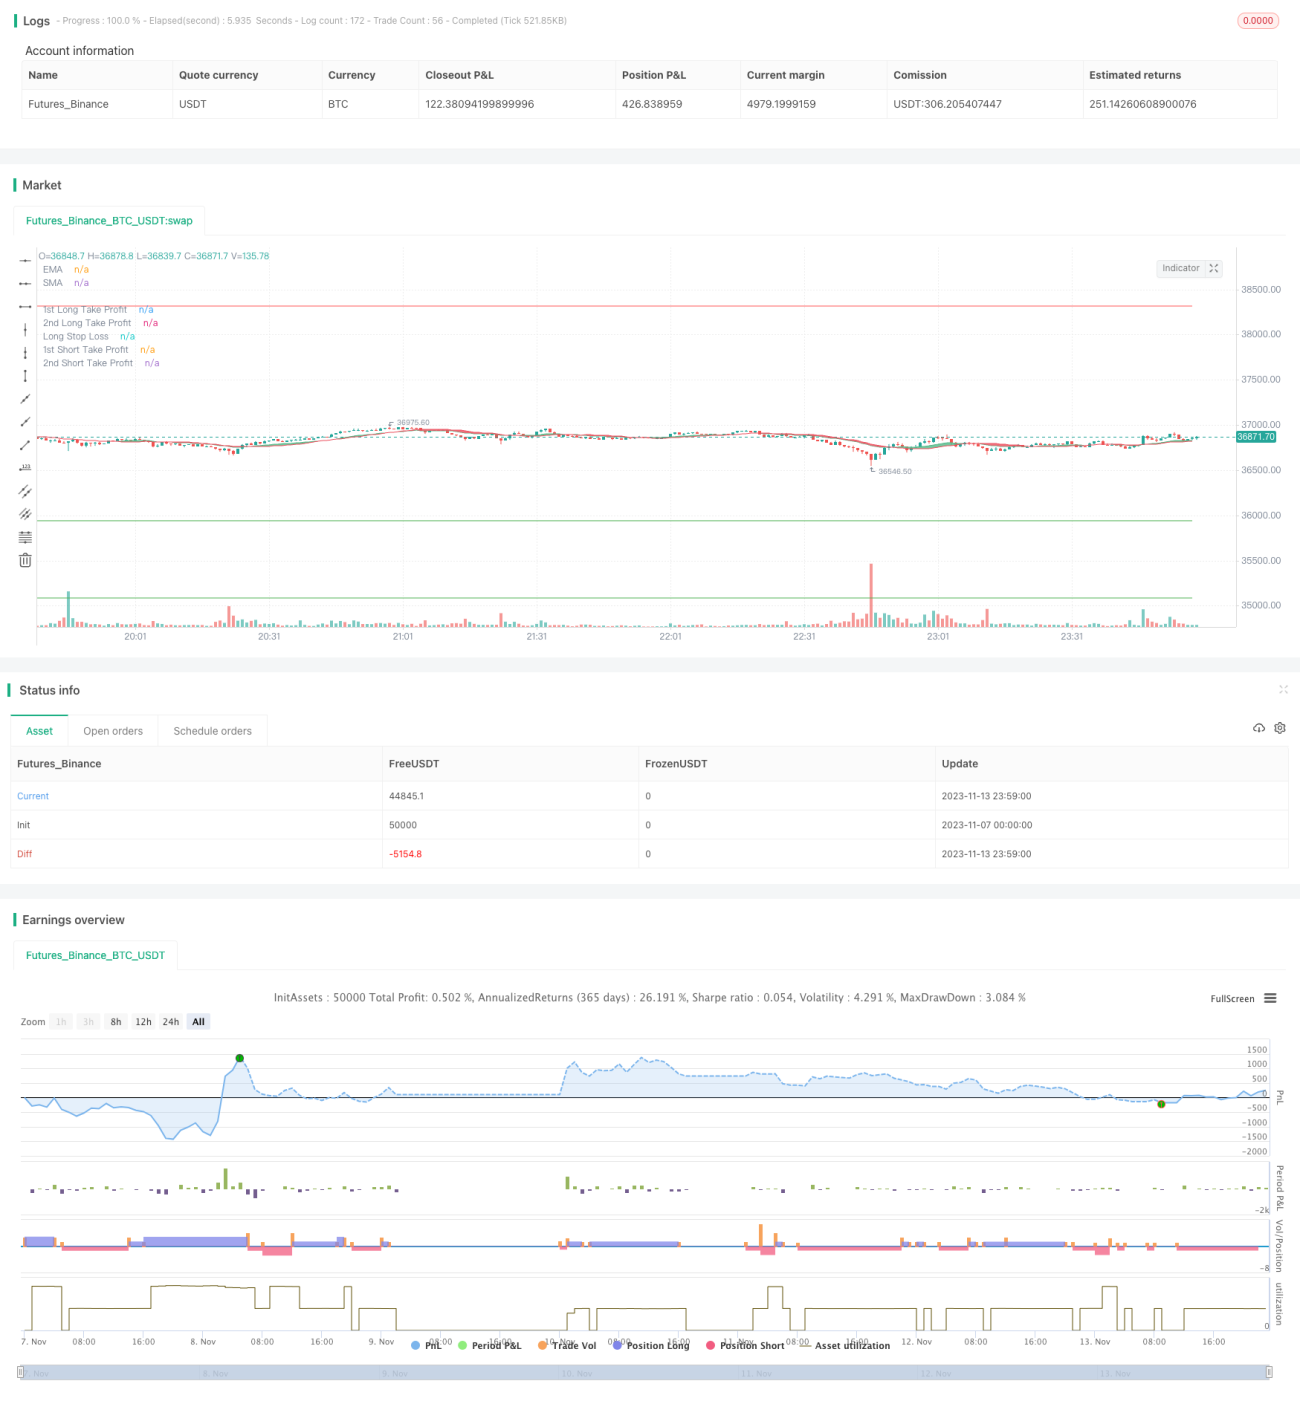
/*backtest
start: 2023-11-07 00:00:00
end: 2023-11-14 00:00:00
period: 1m
basePeriod: 1m
exchanges: [{"eid":"Futures_Binance","currency":"BTC_USDT"}]
*/
//@version=4
strategy("Growth Producer", overlay=true, initial_capital = 1000, currency = "USD", pyramiding = 2, commission_type=strategy.commission.percent, commission_value=0.07, default_qty_type = strategy.percent_of_equity, default_qty_value = 100)
//Functions
Atr(p) =>
atr = 0.
Tr = max(high - low, max(abs(high - close[1]), abs(low - close[1])))
atr := nz(atr[1] + (Tr - atr[1])/p,Tr)
/// TREND
ribbon_period = input(19, "Period", step=1)
leadLine1 = ema(close, ribbon_period)
leadLine2 = sma(close, ribbon_period)
p1 = plot(leadLine1, color= #53b987, title="EMA", transp = 50, linewidth = 1)
p2 = plot(leadLine2, color= #eb4d5c, title="SMA", transp = 50, linewidth = 1)
fill(p1, p2, transp = 60, color = leadLine1 > leadLine2 ? #53b987 : #eb4d5c)
// Relative volatility index
length = input(120,"RVI period", minval=1), src = close
len = 14
stddev = stdev(src, length)
upper = ema(change(src) <= 0 ? 0 : stddev, len)
lower = ema(change(src) > 0 ? 0 : stddev, len)
rvi = upper / (upper + lower) * 100
benchmark = input(35, "RVI benchmark", minval=10, maxval=100, step=0.1)
// Plot RVI
// h0 = hline(80, "Upper Band", color=#C0C0C0)
// h1 = hline(20, "Lower Band", color=#C0C0C0)
// fill(h0, h1, color=#996A15, title="Background")
// offset = input(0, "Offset", type = input.integer, minval = -500, maxval = 500)
// plot(rvi, title="RVI", color=#008000, offset = offset)
/// MFI input
mfi_source = hlc3
mfi_length = input(19, "MFI Length", minval=1)
mfi_lower = input(15, "MFI Lower level", minval=0, maxval=50)
mfi_upper = input(90, "MFI Higher level", minval=50, maxval=100)
// MFI
upper_s = sum(volume * (change(mfi_source) <= 0 ? 0 : mfi_source), mfi_length)
lower_s = sum(volume * (change(mfi_source) >= 0 ? 0 : mfi_source), mfi_length)
mf = rsi(upper_s, lower_s)
// mfp = plot(mf, color=color.new(color.gray,0), linewidth=1)
// top = hline(mfi_upper, color=color.new(color.gray, 100), linewidth=1, editable=false)
// bottom = hline(mfi_lower, color=color.new(color.gray,100), linewidth=1, editable=false)
// hline(0, color=color.new(color.black,100), editable=false)
// hline(100, color=color.new(color.black,100), editable=false)
// Breaches
// b_color = (mf > mfi_upper) ? color.new(color.red,70) : (mf < mfi_lower) ? color.new(color.green,60) : na
// bgcolor(HighlightBreaches ? b_color : na)
// fill(top, bottom, color=color.gray, transp=75)
// Initial inputs
Act_RSI_VWAP_long = input(true, "RSI VOLUME WEIGHTED AVERAGE PRICE LONG")
RSI_VWAP_length_long = input(16, "RSI-VWAP LENGTH LONG")
RSI_VWAP_overSold_long = input(13, "RSI-VWAP OVERSOLD LONG", type=input.float)
RSI_VWAP_overBought_long = input(68, "RSI-VWAP OVERBOUGHT LONG", type=input.float)
Act_RSI_VWAP_short = input(true, "RSI VOLUME WEIGHTED AVERAGE PRICE SHORT")
RSI_VWAP_length_short = input(14, "RSI-VWAP LENGTH SHORT")
RSI_VWAP_overSold_short = input(7, "RSI-VWAP OVERSOLD SHORT", type=input.float)
RSI_VWAP_overBought_short = input(68, "RSI-VWAP OVERBOUGHT SHORT", type=input.float)
// RSI with VWAP as source
RSI_VWAP_long = rsi(vwap(close), RSI_VWAP_length_long)
RSI_VWAP_short = rsi(vwap(close), RSI_VWAP_length_short)
// Plot Them Separately.
// Plotting LONG, Put overlay=false
// r=plot(RSI_VWAP_long, color = RSI_VWAP_long > RSI_VWAP_overBought_long ? color.red : RSI_VWAP_lnog < RSI_VWAP_overSold_long ? color.lime : color.blue, title="rsi", linewidth=2, style=plot.style_line)
// h1=plot(RSI_VWAP_overBought_long, color = color.gray, style=plot.style_stepline)
// h2=plot(RSI_VWAP_overSold_long, color = color.gray, style=plot.style_stepline)
// fill(r,h1, color = RSI_VWAP_long > RSI_VWAP_overBought_long ? color.red : na, transp = 60)
// fill(r,h2, color = RSI_VWAP_long < RSI_VWAP_overSold_long ? color.lime : na, transp = 60)
// Plotting SHORT, Put overlay=false
// r=plot(RSI_VWAP_short, color = RSI_VWAP_short > RSI_VWAP_overBought_short ? color.red : RSI_VWAP_short < RSI_VWAP_overSold_short ? color.lime : color.blue, title="rsi", linewidth=2, style=plot.style_line)
// h1=plot(RSI_VWAP_overBought_short, color = color.gray, style=plot.style_stepline)
// h2=plot(RSI_VWAP_overSold_short, color = color.gray, style=plot.style_stepline)
// fill(r,h1, color = RSI_VWAP_short > RSI_VWAP_overBought_short ? color.red : na, transp = 60)
// fill(r,h2, color = RSI_VWAP_short < RSI_VWAP_overSold_short ? color.lime : na, transp = 60)
/////// STRATEGY Take Profit / Stop Loss ////////
////// LONG //////
long_tp1_inp = input(3.3, title='Long Take Profit 1 %', step=0.1)/100
long_tp1_qty = input(15, title="Long Take Profit 1 Qty", step=1)
long_tp2_inp = input(12, title='Long Take Profit 2%', step=0.1)/100
long_tp2_qty = input(100, title="Long Take Profit 2 Qty", step=1)
long_sl_inp = input(3.3, title='Long Stop Loss %', step=0.1)/100
long_take_level_1 = strategy.position_avg_price * (1 + long_tp1_inp)
long_take_level_2 = strategy.position_avg_price * (1 + long_tp2_inp)
long_stop_level = strategy.position_avg_price * (1 - long_sl_inp)
////// SHORT //////
short_tp1_inp = input(3.2, title='Short Take Profit 1 %', step=0.1)/100
short_tp1_qty = input(20, title="Short Take Profit 1 Qty", step=1)
short_tp2_inp = input(5.5, title='Short Take Profit 2%', step=0.1)/100
short_tp2_qty = input(100, title="Short Take Profit 2 Qty", step=1)
short_sl_inp = input(3.2, title='Short Stop Loss %', step=0.1)/100
short_take_level_1 = strategy.position_avg_price * (1 - short_tp1_inp)
short_take_level_2 = strategy.position_avg_price * (1 - short_tp2_inp)
short_stop_level = strategy.position_avg_price * (1 + short_sl_inp)
///Strategy_Conditions
/// LONG ///
entry_long =(crossover(RSI_VWAP_long, RSI_VWAP_overSold_long) and leadLine2<leadLine1) or (crossunder(mf,mfi_lower) and leadLine2<leadLine1)
entry_price_long=valuewhen(entry_long,close,0)
exit_long =crossunder(RSI_VWAP_long, RSI_VWAP_overBought_long)
/// SHORT ///
entry_short =crossunder(RSI_VWAP_short, RSI_VWAP_overBought_short) and leadLine2>leadLine1 or (crossover(mf,mfi_upper) and leadLine2>leadLine1)
entry_price_short=valuewhen(entry_short,close,0)
exit_short =crossover(RSI_VWAP_short, RSI_VWAP_overSold_short)
////// BACKTEST PERIOD ///////
testStartYear = input(2019, "Backtest Start Year")
testStartMonth = input(1, "Backtest Start Month")
testStartDay = input(1, "Backtest Start Day")
testPeriodStart = timestamp(testStartYear,testStartMonth,testStartDay,0,0)
testStopYear = input(2020, "Backtest Stop Year")
testStopMonth = input(12, "Backtest Stop Month")
testStopDay = input(31, "Backtest Stop Day")
testPeriodStop = timestamp(testStopYear,testStopMonth,testStopDay,0,0)
testPeriod() => true
if testPeriod()
if strategy.position_size == 0 or strategy.position_size > 0 and rvi>benchmark
strategy.entry("long", true, when = entry_long, comment="Insert Enter Long Comment")
strategy.exit("TP1","long", qty_percent=long_tp1_qty, limit=long_take_level_1, stop=long_stop_level)
strategy.exit("TP2","long", qty_percent=long_tp2_qty, limit=long_take_level_2, stop=long_stop_level)
strategy.close("long", when=exit_long, comment = "Insert Exit Long Comment")
if strategy.position_size == 0 or strategy.position_size < 0 and rvi>benchmark
strategy.entry("short", false, when = entry_short, comment="Insert Enter Short Comment")
strategy.exit("TP1","short", qty_percent=short_tp1_qty, limit=short_take_level_1, stop=short_stop_level)
strategy.exit("TP2","short", qty_percent=short_tp2_qty, limit=short_take_level_2, stop=short_stop_level)
strategy.close("short", when=exit_short, comment = "Insert Exit Short Comment")
// LONG POSITION
plot(strategy.position_size > 0 ? long_take_level_1 : na, style=plot.style_linebr, color=color.green, linewidth=1, title="1st Long Take Profit")
plot(strategy.position_size > 0 ? long_take_level_2 : na, style=plot.style_linebr, color=color.green, linewidth=1, title="2nd Long Take Profit")
plot(strategy.position_size > 0 ? long_stop_level : na, style=plot.style_linebr, color=color.red, linewidth=1, title="Long Stop Loss")
// SHORT POSITION
plot(strategy.position_size < 0 ? short_take_level_1 : na, style=plot.style_linebr, color=color.green, linewidth=1, title="1st Short Take Profit")
plot(strategy.position_size < 0 ? short_take_level_2 : na, style=plot.style_linebr, color=color.green, linewidth=1, title="2nd Short Take Profit")
plot(strategy.position_size < 0 ? short_stop_level : na, style=plot.style_linebr, color=color.red, linewidth=1, title="Long Stop Loss")