하이 및 로우 TEMA 평균 진동 전략

1
Follow
1778
Followers
개요
이 전략은 TEMA, VWMACD, HMA의 세 가지 지표를 사용하여 비트코인의 하락세를 포착합니다. 그것의 주요 논리는 VWMACD 아래 0 축을 통과하면 HMA 평균보다 낮은 가격과 빠른 TEMA가 느린 TEMA보다 낮은 가격으로 공백합니다. VWMACD 위 0 축을 통과하면 HMA 평균보다 높은 가격이나 빠른 TEMA 위 느린 TEMA를 통과하면 평점입니다.
원칙
먼저 VWMACD를 계산하고, 기둥 모양의 그래프를 그립니다. 그리고 HMA를 트렌드 필터로 추가합니다. 그 다음, 빠른 라인 TEMA를 만들고, 느린 라인을 추가합니다.
구체적인 입시 규칙은: VWMACD가 0축보다 낮고, 가격이 HMA 평균선보다 낮고, 패스트 라인 TEMA가 슬로 라인 TEMA보다 낮을 때 공백을 <unk>다.
구체적인 출전 규칙은: VWMACD에서 0축을 통과할 때, 가격이 HMA 평균선이나 빠른 선 TEMA에서 느린 선 TEMA를 통과할 때 평점.
우위 분석
- 3개의 지표 조합을 사용하여 거래 신호의 신뢰성을 높였습니다.
- VWMACD는 보다 정확한 추세 판단을 제공하는 데에서 벗어난 것을 식별할 수 있습니다.
- HMAfilt은 트렌드 필터로 잡음으로부터의 오해를 방지합니다.
- TEMA 포트폴리오는 단기적 역전점을 포착한다
- 단기 주기 변수를 사용하여 고주파 거래에 적합하며, 단기 하락 시장을 포착합니다.
위험 분석
- 다중 지표 조합, 변수 설정이 더 복잡, 경험이 필요 조정
- HMA 필터에도 불구하고, 흔들리는 시장의 가짜 돌파구를 막아야 합니다.
- 짧은 주기의 파라미터는 시장 소음에 방해가 될 수 있으며, 오류 신호가 발생합니다.
- 예상보다 더 큰 손실을 방지하기 위해 엄격한 스톱로스 관리가 필요합니다.
- 거래비용 통제에 주의해야 합니다. 초고주파 거래는 수수료 마찰로 인해 손실될 수 있습니다.
최적화 방향
- 다양한 주기에서 최적의 변수를 찾기 위해 변수 조합을 테스트할 수 있습니다.
- RSI, KD와 같은 다른 지표가 추가될 수 있습니다.
- 다양한 시장 상황에 따라 적응 가능한 매개 변수
- 가격 이동에 따라 중지하는 것과 같은 절감 전략을 최적화 할 수 있습니다.
- 양적 에너지 지표와 결합하여 양적 에너지 부족으로 인한 가짜 돌파구를 피할 수 있습니다.
요약하다
이 전략은 VWMACD, HMA 및 빠른 속도 TEMA의 조합을 사용하며, Ziel는 비트코인의 단기 하락 트렌드를 포착합니다. 그것의 장점은 신호가 신뢰할 수 있고, 고 주파수 거래에 적합합니다. 그러나 또한 변수 조정 복잡성이 있으며, 노이즈 방해에 취약합니다. 변수 조합을 계속 최적화하고 보조 지표를 추가함으로써 전략을 더 안정적으로 신뢰할 수 있습니다.
Source
Pine
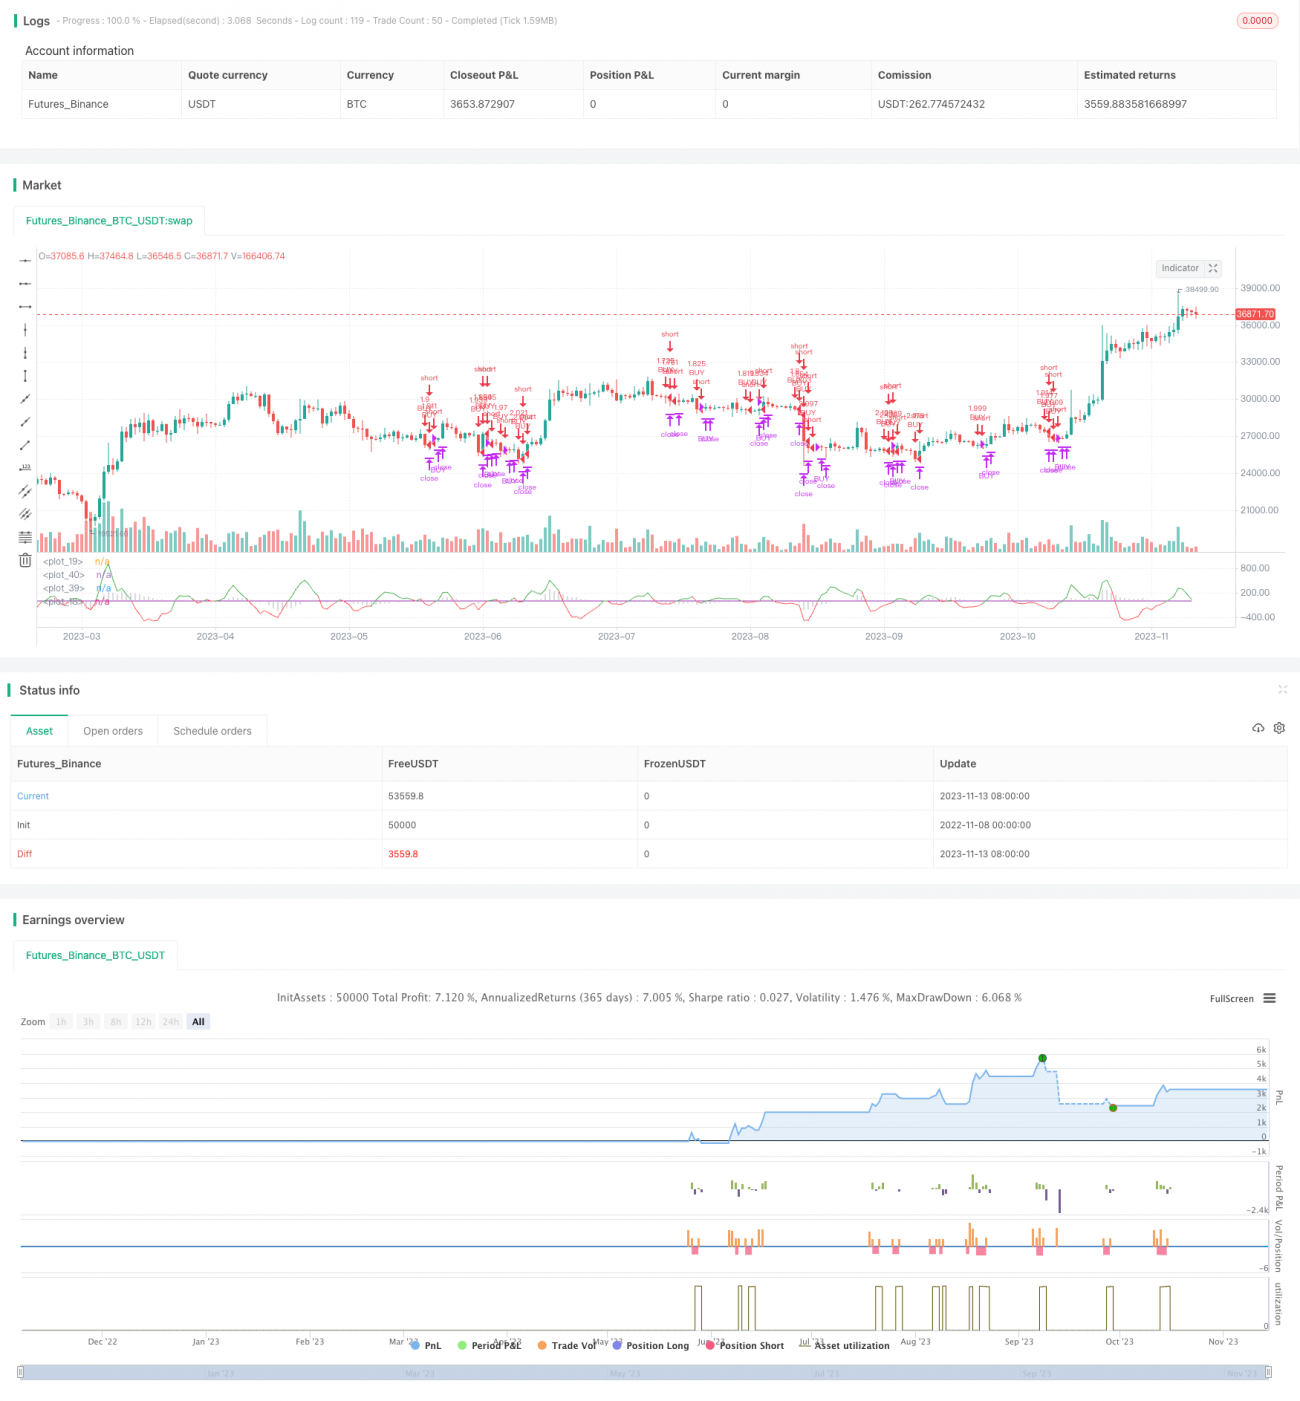
/*backtest
start: 2022-11-08 00:00:00
end: 2023-11-14 00:00:00
period: 1d
basePeriod: 1h
exchanges: [{"eid":"Futures_Binance","currency":"BTC_USDT"}]
*/

//@version=4
strategy(title="TEMA_HMA_VWMACD short strategy", shorttitle="Short strategy", overlay=false, default_qty_type=strategy.percent_of_equity, default_qty_value=100, commission_type=strategy.commission.percent, commission_value=0.018, currency='USD')
startP = timestamp(input(2017, "Start Year"), input(12, "Month"), input(17, "Day"), 0, 0)
end = timestamp(9999,1,1,0,0)Strategy parameters
Related strategies
Comment
All comments (0)
No data
- 1