이치모쿠 킨코 효 트레이딩 전략

개요
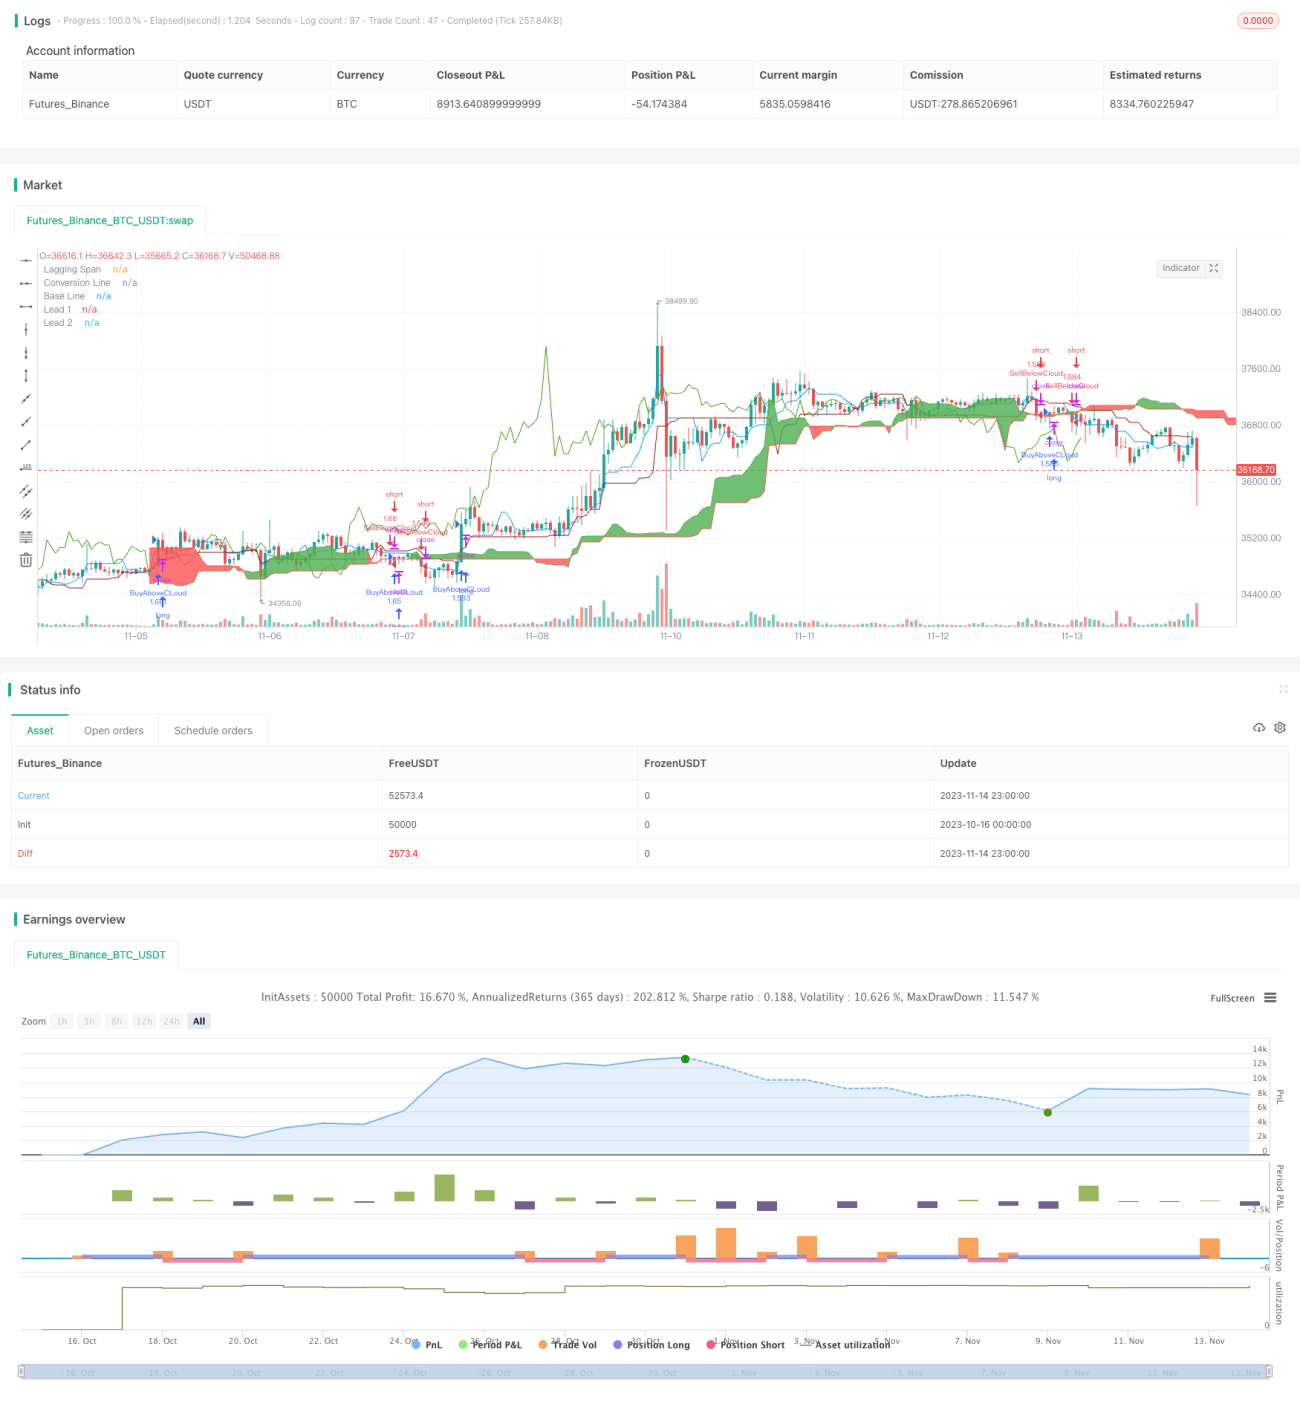
이치모쿠 킨코 히오 (Ichimoku Kinko Hyo) 거래 전략은 이치모쿠 기술 지표에 기반한 트렌드 추적 전략이다. 이 전략은 이치모쿠의 전환선, 기준선, 선도선 1, 선도선 2 등의 지표를 사용하여 트렌드 방향을 판단하고, 진출 및 중단 시간을 판단한다.
전략 원칙
이 전략은 다음의 네 가지 조건에 따라 거래 방향을 결정합니다.
- 마감가격이 기준선 위의 26주 평균값을 통과할 때 더 많은 것을 합니다.
- 마감 가격 아래에서 기준선 아래의 26주 평균값을 통과할 때, 공백을 둡니다.
- 정지 조건: 3.5%
- 손해배상 조건: 1.5%
구체적으로, 전략은 먼저 전환선, 기준선, 선도선 1과 선도선 2을 계산한다. 그리고 닫기 가격이 클라우드 그래프의 상단 또는 하단 경계를 뚫었는지 판단하고, 오버 또는 오브를 결정한다.
만약 가격 위에 클라우드 그래프를 가로질러 26회 평균값을 닫는다면, 즉 선두선 1과 선두선 2의 더 큰 값을 가로질러, 주가가 상승 추세에 들어간다는 것을 나타낸다면, 이 때 더 많이 한다.
만약 가격이 아래로 흐르는 그림의 아래쪽을 닫으면, 즉 26시즌의 평균값을 26시즌 동안 흐르는 선두선 1과 선두선 2의 더 작은 값으로 닫으면, 주가가 하향 추세에 들어간다는 것을 나타냅니다. 이 때 공백을 <unk>다.
입점 후 정지 조건과 중지 조건. 정지 조건은 입점 가격의 3.5%, 중지 조건은 입점 가격의 1.5%이다.
우위 분석
이치모쿠 킨코 히오의 거래 전략은 다음과 같은 장점을 가지고 있습니다.
- 트렌드의 변화를 인식하고, 트렌드에 조기에 접근할 수 있습니다.
- 클라우드 그래프를 사용하여 지원 및 저항 영역을 판단하여 진입이 더 정확합니다.
- 가격과 거래량을 고려할 때, 가짜 돌파구에 속지 마십시오.
- 정지/손실 조건이 명확하여 거래 위험을 통제할 수 있습니다.
위험 분석
이치모쿠 킨코 히오의 거래 전략에는 위험도 있습니다.
- "이런 일이 벌어질 수 있는 이유는, 이 모든 것이, 이 모든 것들이, 이 모든 것들이, 이 모든 것들이, 이 모든 것들이"
- 트렌드가 바뀌면 더 큰 손실이 발생할 수 있습니다.
- 여러 조건을 동시에 충족해야 입학할 수 있고, 기회는 적다.
- 잘못 설정된 파라미터는 지표 신호를 왜곡할 수 있습니다.
대책:
- 적절한 입시 조건의 완화, 거래의 기회의 증대
- 시장 특성에 맞게 최적화 매개 변수
- 다른 지표와 함께 가짜 신호를 필터링
최적화 방향
Ichimoku Kinko Hyo의 거래 전략은 다음과 같은 측면에서 최적화 될 수 있습니다.
- 전환선, 기준선 등의 파라미터를 최적화하여 다른 주기의 시장 상황에 더 적합하게 만듭니다.
- 입학 조건을 최적화하여 더 나은 기회를 놓치지 않도록
- 더 높은 리스크 조정 수익을 달성하기 위해 스톱 스톱 손실 전략을 최적화
- 다른 지표와 결합하여 신호를 필터링하여 중매를 줄이십시오.
- 동적으로 포지션을 조정하여 시장의 변동에 따라 구체적인 투자 금액을 결정합니다.
요약하다
Ichimoku Kinko Hyo의 거래 전략은 전반적으로 잠재적인 트렌드를 적시에 캡처 할 수있는 상대적으로 좋은 전략입니다. 그러나 강력한 거래 시스템을 형성하기 위해 다른 지표와 더 많은 최적화와 조합이 필요합니다.
/*backtest
start: 2023-10-16 00:00:00
end: 2023-11-15 00:00:00
period: 1h
basePeriod: 15m
exchanges: [{"eid":"Futures_Binance","currency":"BTC_USDT"}]
*/

//@version=4
strategy("Ichimoku system", overlay=true, initial_capital = 100000, default_qty_type = strategy.percent_of_equity, default_qty_value=100)

buyOnly = input(false, "only shows buying Trade", type = input.bool)- 1