
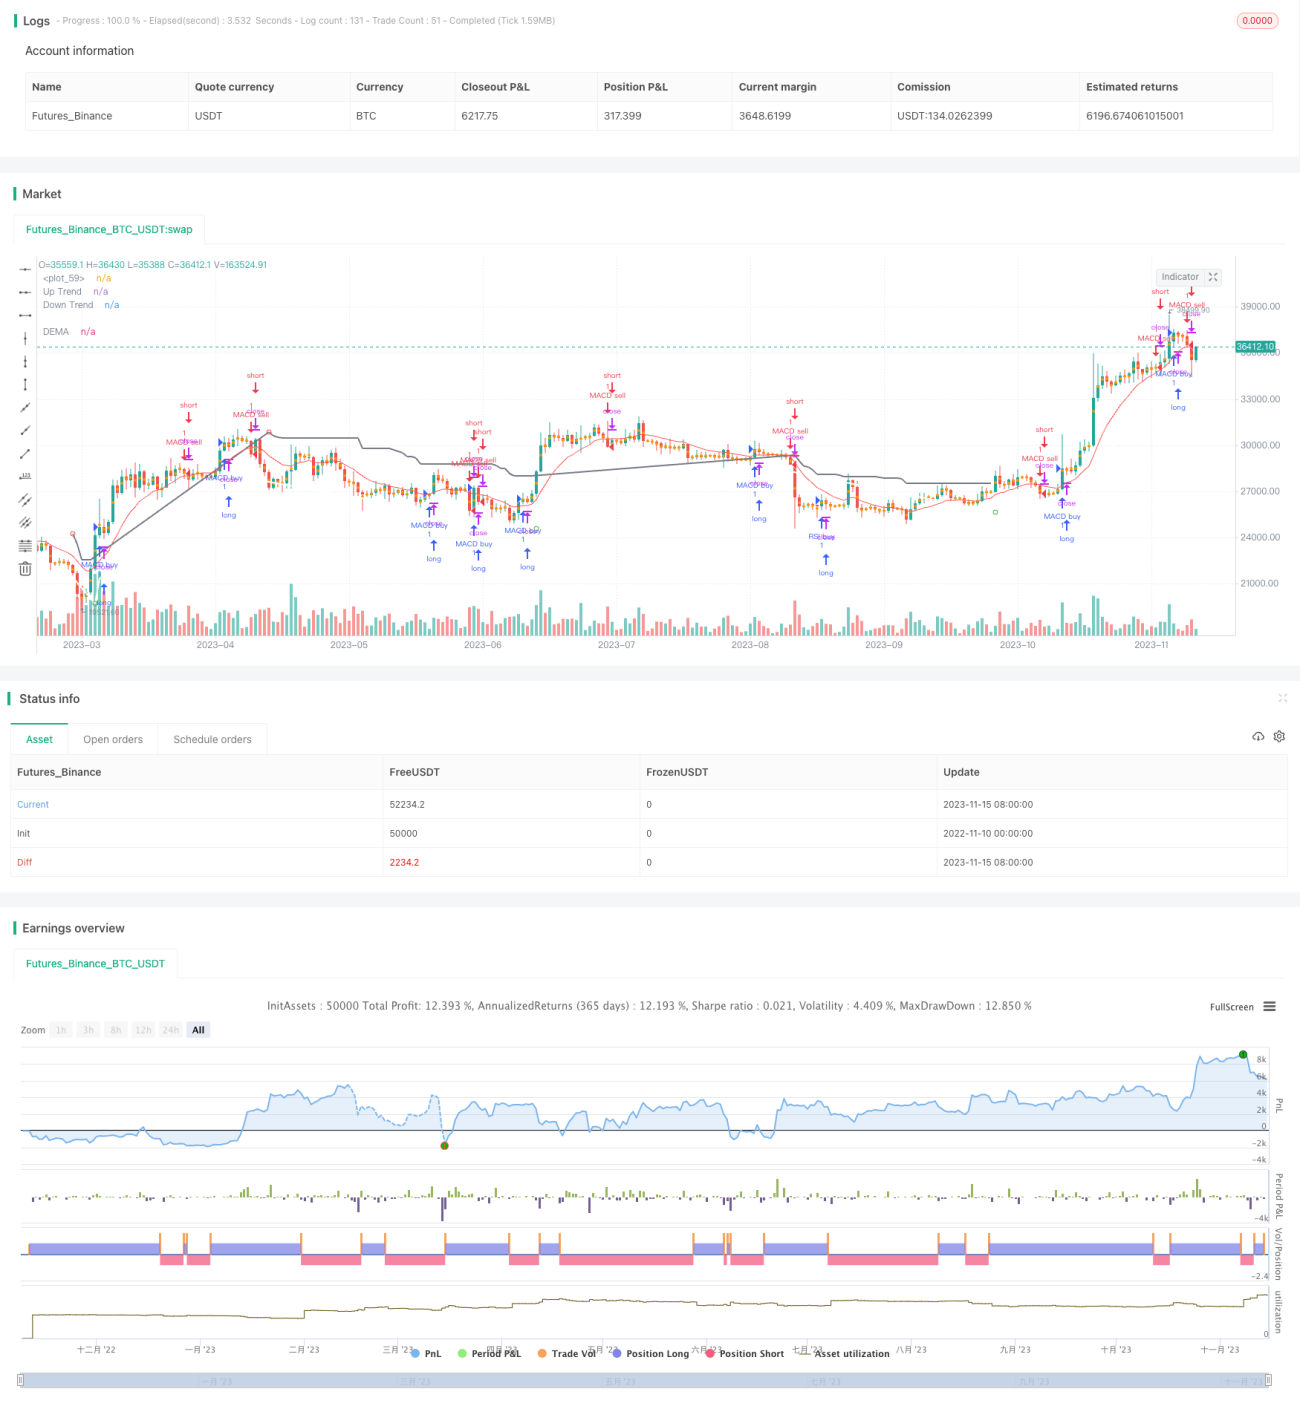
다중 트렌드 추적 전략은 MACD, RSI, ATR 및 DEMA의 네 가지 지표를 통합하여 주식의 장기 및 단기 트렌드를 식별하여 트렌드 추적 거래를합니다. 이 전략은 브레이크 트레이드 및 트렌드 추적 거래의 장점을 결합하여 더 긴 선의 추세를 포착 할 수 있으며 짧은 선에서 더 나은 진입 시점을 찾을 수 있습니다.
이동 평균 분산 지표인 MACD는 트렌드 추적 형식의 지표이다. MACD는 빠른 이동 평균과 느린 이동 평균으로 구성되어 있으며, 일반적으로 패러미터는 빠른 선 12일 EMA, 느린 선 26일 EMA, 신호 선은 MACD의 9일 EMA이다. MACD 위쪽이 신호를 통과하면 구매 신호이며, 아래쪽은 판매 신호이다. 이 전략은 MACD의 금형 사각형을 사용하여 트렌드 방향을 판단한다.
RSI는 상대적으로 강한 지수이며, 주식의 과매매 상황을 반영한다. RSI는 한 기간 동안의 평균 종결 상승과 평균 종결 하락을 비교하여 결정한다.
이 전략은 MACD, RSI, ATR, DEMA의 네 가지 지표를 통합하여 트렌드 추적과 브레이크 거래를 병행하여 트렌드에서 더 나은 입문 시기를 찾을 수 있습니다.
MACD는 중·장기 동향의 방향과 전환을 효과적으로 식별할 수 있다.
RSI는 단기간에 주식이 과매매되거나 과매매되는지를 판단하여 트렌드 반전 지점에서 부진을 추적하는 것을 피합니다.
ATR은 단독 손실을 효과적으로 제어하기 위해 스톱 라인 위치를 동적으로 조정합니다.
DEMA는 보조적인 판단 지표로서, 일부 소음을 필터링할 수 있다.
다중 지표 조합은 거래 신호의 신뢰성을 높일 수 있습니다.
이 전략에는 위험도 있습니다.
다중 지표 조합은 불일치로 인해 거래 신호 오류가 발생할 수 있습니다.
ATR은 동적 상쇄 지표로, 큰 변동에서 상쇄되어 손실을 초래할 수 있습니다.
DEMA는 트렌드 파동 지표로써, 강력한 단기 거래 기회를 필터링할 수 있다.
잘못된 전략적 매개 변수는 거래의 빈도, 거래 비용 및 슬라이드 손실을 증가시킬 수 있습니다.
위험을 통제하기 위해 지표 파라미터를 적절히 조정할 수 있으며, 다른 보조 판단 지표를 추가하여 확인합니다.
이 전략은 다음과 같은 부분에서 최적화될 수 있습니다.
다양한 변수 조합을 테스트하여 최적의 변수를 찾습니다.
이동 상쇄, 평균 상쇄와 같은 상쇄 전략을 추가하여 위험을 더욱 통제하십시오.
KDJ, 브린 밴드 등과 같은 보조 판단 지표가 추가되어 신호의 정확도가 향상되었다.
진입 시점을 최적화하여, 예를 들어, 브레이크와 같은 전략과 결합하여, 더 좋은 매출점을 찾습니다.
다단계와 공백시장을 구분하여 다른 파라미터를 사용한다.
주식 특성에 따라 분류 모형화하여 전략을 더 적응시킬 수 있습니다.
다중 트렌드 추적 전략은 MACD, RSI, ATR 및 DEMA의 4개의 지표를 통합하여 트렌드 추적과 트렌드 돌파의 유기적인 결합을 실현한다. 단일 지표 전략에 비해 이 전략은 더 신뢰할 수 있는 거래 신호를 제공하여 특정 가짜 신호를 피한다. 파라미터 최적화, 손해 방지 전략, 보조 판단 등의 방법으로 전략 효과를 더욱 향상시킬 수 있다. 이 전략은 트렌드 회전 능력에 대한 요구가 높은 정량 거래에 적합하며, 장기간 추적 및 최적화 전략 사고 방식이다.
/*backtest
start: 2022-11-10 00:00:00
end: 2023-11-16 00:00:00
period: 1d
basePeriod: 1h
exchanges: [{"eid":"Futures_Binance","currency":"BTC_USDT"}]
*/
// This source code is subject to the terms of the Mozilla Public License 2.0 at https://mozilla.org/MPL/2.0/
// © prim722
// © OTS Music
//@version=4
strategy("Atrend by OTS", overlay=true)
fastLength = input(12)
slowlength = input(26)
MACDLength = input(9)
MACD = ema(close, fastLength) - ema(close, slowlength)
aMACD = ema(MACD, MACDLength)
delta = MACD - aMACD
if (crossover(delta, 0))
strategy.entry("MACD buy", strategy.long, comment="MACD buy")
if (crossunder(delta, 0))
strategy.entry("MACD sell", strategy.short, comment="MACD sell")
//plot(strategy.equity, title="equity", color=color.red, linewidth=2, style=plot.style_areabr)
length = input( 18 )
overSold = input( 30 )
overBought = input( 70 )
price = close
vrsi = rsi(price, length)
co = crossover(vrsi, overSold)
cu = crossunder(vrsi, overBought)
if (not na(vrsi))
if (co)
strategy.entry("RSI buy", strategy.long, comment="RSI buy")
if (cu)
strategy.entry("RSI sell", strategy.short, comment="RSI sell")
//plot(strategy.equity, title="equity", color=color.red, linewidth=2, style=plot.style_areabr)
Periods = input(title="ATR Period", type=input.integer, defval=10)
src = input(hl2, title="Source")
Multiplier = input(title="ATR Multiplier", type=input.float, step=0.1, defval=3.0)
changeATR= input(title="Change ATR Calculation Method ?", type=input.bool, defval=true)
showsignals = input(title="Show Buy/Sell Signals ?", type=input.bool, defval=false)
highlighting = input(title="Highlighter On/Off ?", type=input.bool, defval=false)
atr2 = sma(tr, Periods)
atr= changeATR ? atr(Periods) : atr2
up=src-(Multiplier*atr)
up1 = nz(up[1],up)
up := close[1] > up1 ? max(up,up1) : up
dn=src+(Multiplier*atr)
dn1 = nz(dn[1], dn)
dn := close[1] < dn1 ? min(dn, dn1) : dn
trend = 1
trend := nz(trend[1], trend)
trend := trend == -1 and close > dn1 ? 1 : trend == 1 and close < up1 ? -1 : trend
upPlot = plot(trend == 1 ? up : na, title="Up Trend", style=plot.style_line, linewidth=2, color=color.white)
buySignal = trend == 1 and trend[1] == -1
plotshape(buySignal ? up : na, title="UpTrend Begins", location=location.absolute, style=shape.circle, size=size.tiny, color=color.green, transp=0)
plotshape(buySignal and showsignals ? up : na, title="", text="", location=location.absolute, style=shape.labelup, size=size.tiny, color=color.white, textcolor=color.white, transp=0)
dnPlot = plot(trend == 1 ? na : dn, title="Down Trend", style=plot.style_line, linewidth=2, color=color.gray)
sellSignal = trend == -1 and trend[1] == 1
plotshape(sellSignal ? dn : na, title="DownTrend Begins", location=location.absolute, style=shape.circle, size=size.tiny, color=color.red, transp=0)
plotshape(sellSignal and showsignals ? dn : na, title="", text="", location=location.absolute, style=shape.labeldown, size=size.tiny, color=color.red, textcolor=color.white, transp=0)
mPlot = plot(ohlc4, title="", style=plot.style_circles, linewidth=0)
longFillColor = highlighting ? (trend == 1 ? color.white : color.white) : color.white
shortFillColor = highlighting ? (trend == -1 ? color.gray : color.white) : color.white
fill(mPlot, upPlot, title="UpTrend Highligter", color=longFillColor)
fill(mPlot, dnPlot, title="DownTrend Highligter", color=shortFillColor)
alertcondition(buySignal, title="ATrend Buy", message="ATrend Buy!")
alertcondition(sellSignal, title="ATrend Sell", message="ATrend Sell!")
changeCond = trend != trend[1]
alertcondition(changeCond, title="ATrend Direction Change", message="ATrend has changed direction!")
length1 = input(25, minval=1)
srcb = input(close, title="Source")
e1 = ema(srcb, length1)
e2 = ema(e1, length)
dema = 2 * e1 - e2
plot(dema, "DEMA", color.red)