
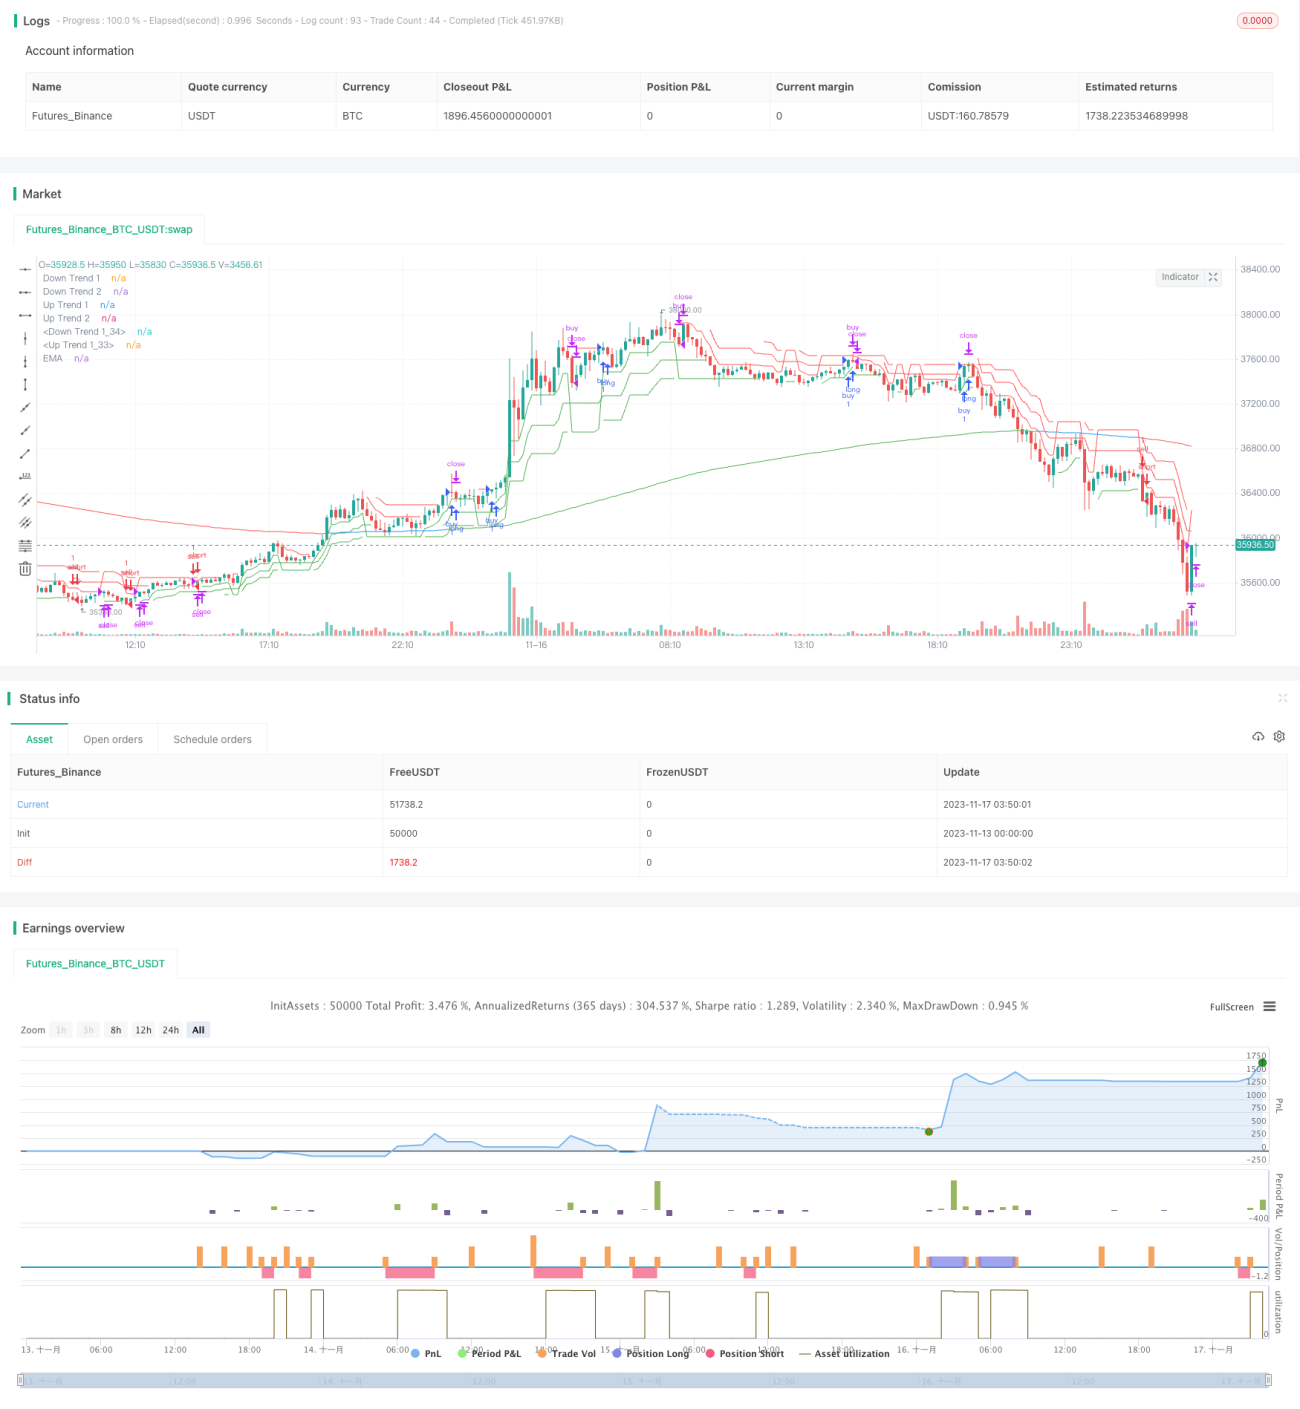
이 전략은 쌍삼각형 통로를 구축하여, 슈퍼 트렌드 지표와 결합하여 가격 돌파의 방향을 판단하여, 높은 승률의 추적 돌파 작업을 달성합니다. 이 전략은 동시에 EMA와 결합하여 시장의 전반적인 추세를 판단하여, 충격적인 상황에서 무효 거래를 피합니다.
가격의 단기, 중기 및 장기적인 경향 방향을 판단하기 위해 세 가지 다른 매개 변수의 슈퍼 트렌드 지표를 구성한다.
이중 삼각형 통로를 통해 가격이 상향 또는 하향 통로를 뚫었는지 판단하여 리스트 엔트리 및 엑시트 신호로 사용한다.
233주기의 EMA와 결합하여 전체 트렌드 방향을 판단합니다. 가격은 EMA 다목적 시장에서 상향 채널을 뚫기 위해 더 많은 것을 할 필요가 있으며, 공백 시장에서 하향 채널을 뚫기 위해 공백을 할 수 있습니다.
세 개의 슈퍼 트렌드 지표와 결합하여 정지 및 중단 신호를 판단하십시오. 두 개 이상의 지표가 변하면 정지 또는 중단하십시오.
이중 삼각형 통로는 다중 시간 주기의 판단과 결합하여 트렌드 돌파구를 정확하게 포착할 수 있다.
다단계 필터링 조건은 무효 거래를 방지하고 승률을 높여줍니다.
동적 추적 스톱 스톱 손실, 철회 위험을 낮추기.
간단한 매개 변수 설정, 사용하기 쉽다.
대주기적인 흔들림 시장에서 자주 포지션을 열고 그 후 손실이 발생하는 경우가 발생할 수 있습니다. ATR 주기 파라미터를 적절히 조정하여 포지션 개시 빈도를 낮출 수 있습니다.
EMA 주기가 너무 짧으면 전체 추세를 판단할 수 없으며, 너무 길으면 추적은 민감하지 않다. 최적의 EMA 매개 변수를 결정하는 테스트를 권장한다.
스톱 로즈 레벨은 동적으로 시장 변동의 변화를 추적할 수 없으며, 인적 개입이 필요합니다. 후기에는 ATR 동적으로 스톱 로즈 거리를 조정하는 것을 고려할 수 있습니다.
달빛 추적자 이중 삼각형 돌파 전략은 슈퍼 트렌드 지표와 이중 삼각형 통로를 결합하여 강력한 돌파를 정확하게 포착합니다. 동시에 다단계 필터링 메커니즘은 비효율적 인 신호를 필터링 할 수 있으며, 높은 승률을 가지고 있습니다. 간단한 파라미터 설정은 사용도 쉽게합니다.
/*backtest
start: 2023-11-13 00:00:00
end: 2023-11-17 04:00:00
period: 10m
basePeriod: 1m
exchanges: [{"eid":"Futures_Binance","currency":"BTC_USDT"}]
*/
// @version=5
// author=theasgard and moonshot-indicator (ms)
// year 2021
//
// This is a well knowen strategy by using 3 different Supertrends and a trend-defining EMA,
// feel free to play around with the settings, a backtest on 8h ETHUSDT pair brought some good results using
// the 233EMA and investing 75% of a 10k start capital
//
// the idea is to have at least 2 supertrnds going green above the trend-EMA to go long and exit by turning
// 2 supertrends red (idea: 1 supertrend in red could initialize a take profit)
// shorts work vice versa
// The EMA shows in green for uptrends and in red for downtrends, if it is blue no Signal will be taken because
// the 3 supertrends are not all above or below the trendline(EMA)
strategy("ms hypertrender", overlay=true)
// set up 3 supertrendlines and colour the direction up/down
atrPeriod1 = input(10, "ATR Length 1")
factor1 = input.float(1.0, "ATR Factor 1", step = 0.01)
[supertrend1, direction1] = ta.supertrend(factor1, atrPeriod1)
upTrend1 = plot(direction1 < 0 ? supertrend1 : na, "Up Trend 1", color = color.green, style=plot.style_linebr)
downTrend1 = plot(direction1 < 0? na : supertrend1, "Down Trend 1", color = color.red, style=plot.style_linebr)
atrPeriod2 = input(11, "ATR Length 2")
factor2 = input.float(2.0, "ATR Factor 2", step = 0.01)
[supertrend2, direction2] = ta.supertrend(factor2, atrPeriod2)
upTrend2 = plot(direction2 < 0 ? supertrend2 : na, "Up Trend 2", color = color.green, style=plot.style_linebr)
downTrend2 = plot(direction2 < 0? na : supertrend2, "Down Trend 2", color = color.red, style=plot.style_linebr)
atrPeriod3 = input(12, "ATR Length 3")
factor3 = input.float(3.0, "ATR Factor 3", step = 0.01)
[supertrend3, direction3] = ta.supertrend(factor3, atrPeriod3)
upTrend3 = plot(direction3 < 0 ? supertrend3 : na, "Up Trend 1", color = color.green, style=plot.style_linebr)
downTrend3 = plot(direction3 < 0? na : supertrend3, "Down Trend 1", color = color.red, style=plot.style_linebr)
//set up the trend dividing EMA and color uptrend nutreal downtrend
len = input.int(233, minval=1, title="Trend-EMA Length")
src = input(close, title="Source")
offset = input.int(title="Offset", defval=0, minval=-500, maxval=500)
//general Bull or Bear Trend? Visualized by ema
ematrend = ta.ema(src, len)
generaluptrend = supertrend1 > ematrend and supertrend2 > ematrend and supertrend3 > ematrend
generaldowntrend = supertrend1 < ematrend and supertrend2 < ematrend and supertrend3 < ematrend
emacolor = if generaluptrend
color.green
else if generaldowntrend
color.red
else
color.blue
plot(ematrend, title="EMA", color=emacolor, offset=offset)
// Bullish? min 2 supertrends green
bullish = (direction1 < 0 and direction2 < 0) or (direction1 < 0 and direction3 < 0) or (direction2 < 0 and direction3 < 0) and generaluptrend
extremebullish = direction1 < 0 and direction2 < 0 and direction3 < 0 and generaluptrend //all 3 green
// Bearish? min 2 supertrends red
bearish = (direction1 > 0 and direction2 > 0) or (direction1 > 0 and direction3 > 0) or (direction2 > 0 and direction3 > 0) and generaldowntrend
extremebearish = direction1 > 0 and direction2 > 0 and direction3 > 0 and generaldowntrend //all 3 red
// Open Long
//plotchar(((bullish and not bullish[1]) or (extremebullish and not extremebullish[1])) and (emacolor==color.green)? close : na, title = 'Start Long', char='▲', color = #80eb34, location = location.belowbar, size = size.small)
// TP 10% Long
TP10long = ((generaluptrend and bullish[1]) or (generaluptrend and extremebullish[1])) and (direction1 > 0 or direction2 > 0 or direction3 > 0)
//plotchar(TP10long and not TP10long[1]? close : na, title = 'TP on Long', char='┼', color = #ffd000, location = location.abovebar, size = size.tiny)
// Exit Long
//plotchar(extremebearish and not extremebearish[1] or bearish and not bearish[1]? close : na, title = 'Close all Longs', char='Ꭓ', color = #ff0037, location = location.abovebar, size = size.tiny)
// Open Short
//plotchar(((bearish and not bearish[1]) or (extremebearish and not extremebearish[1])) and (emacolor==color.red)? close : na, title = 'Start Short', char='▼', color = #0547e3, location = location.abovebar, size = size.small)
// TP 10% Short
TP10short = ((generaldowntrend and bearish[1]) or (generaldowntrend and extremebearish[1])) and (direction1 < 0 or direction2 < 0 or direction3 < 0)
//plotchar(TP10short and not TP10short[1]? close : na, title = 'TP on Short', char='┼', color = #ffd000, location = location.belowbar, size = size.tiny)
// Exit Short
//plotchar(extremebullish and not extremebullish[1] or bullish and not bullish[1]? close : na, title = 'Close all Shorts', char='Ꭓ', color = #ff0037, location = location.belowbar, size = size.tiny)
// Set stop loss level with input options (optional)
longLossPerc = input.float(title="Long Stop Loss (%)",
minval=0.0, step=0.1, defval=1) * 0.01
shortLossPerc = input.float(title="Short Stop Loss (%)",
minval=0.0, step=0.1, defval=1) * 0.01
// Determine stop loss price
longStopPrice = strategy.position_avg_price * (1 - longLossPerc)
shortStopPrice = strategy.position_avg_price * (1 + shortLossPerc)
openlong = (((bullish and not bullish[1]) or (extremebullish and not extremebullish[1])) and (emacolor==color.green))
openshort = (((bearish and not bearish[1]) or (extremebearish and not extremebearish[1])) and (emacolor==color.red))
exitlong = (extremebearish and not extremebearish[1] or bearish and not bearish[1]) or TP10long
exitshort = (extremebullish and not extremebullish[1] or bullish and not bullish[1]) or TP10short
strategy.entry("buy", strategy.long, when=openlong)
strategy.entry("sell", strategy.short, when=openshort)
strategy.close("buy", when=exitlong)
strategy.close("sell", when=exitshort)
// Submit exit orders based on calculated stop loss price
if (strategy.position_size > 0)
strategy.exit(id="Long Stop", stop=longStopPrice)
if (strategy.position_size < 0)
strategy.exit(id="Short Stop", stop=shortStopPrice)