RSI 및 T3 지표를 기반으로 한 PMax 적응형 브레이크아웃 전략

1
Follow
1779
Followers
개요
이 전략은 RSI와 T3 지표를 사용하여 트렌드를 판단하고, ATR 지표와 결합하여 스톱 로드를 설정하여, PMax을 깨지기 위해 적응하는 양적 거래 전략이다. 주요 아이디어는 트렌드 판단과 스톱 로드 설정을 최적화하여 위험을 제어하면서 수익성을 향상시키는 것이다.
전략 원칙
-
RSI와 T3 지표의 계산으로 트렌드를 결정합니다.
- RSI를 통해 주식 과매매를 판단하는 방법
- RSI를 기반으로 T3을 계산하여 트렌드를 판단합니다.
-
ATR 지표에 따라 PMax 적응 스톱 라인을 설정
- ATR을 변동성의 대표자로 계산합니다.
- T3 지표 위에 아래로 스톱 라인을 설정하고, ATR 지표의 일정한 배수로 라인 폭을 설정합니다.
- 스톱 라인의 적응 조정
-
브레이크 바이와 스톱 아웃
- T3 지표를 넘어서면 구매 신호로 간주됩니다.
- 가격이 스톱 라인을 넘으면 현재 포지션을 종료합니다.
전략적 이점
이 전략은 다음과 같은 장점을 가지고 있습니다.
- RSI와 T3 지표의 조합은 추세를 판단하고 정확도가 높습니다.
- PMax는 자율적으로 HMRC의 위험을 조절합니다.
- ATR 지표는 변동도를 대신하여 너무 급진적이지 않도록 스톱 라인 폭을 설정합니다.
- 철수와 수익성
전략적 위험
이 전략에는 다음과 같은 위험들이 있습니다.
-
역전 위험
단기간에 가격 반전이 발생하면, 스톱더가 트리플되어 손실이 발생할 수 있다. 스톱더 라인을 적절히 느슨하게 하여 반전의 영향을 줄일 수 있다.
-
트렌드 판단 실패의 위험
RSI 및 T3 지표의 추세를 판단하는 효과는 100% 신뢰할 수 없습니다. 판단이 잘못되면 손실이 발생할 수 있습니다. 적절한 변수를 조정하거나 다른 지표를 추가하여 최적화 할 수 있습니다.
전략 최적화 방향
이 전략은 다음의 몇 가지 측면에서 더 개선될 수 있습니다.
- 이동 평균과 같은 다른 지표들을 추가하여 추세에 대한 판단을 돕습니다.
- RSI와 T3 지표의 길이를 최적화합니다.
- 다른 ATR 배수를 스톱 라인 너비로 테스트합니다.
- 시장에 따라 조정된 스톱 라인의 용이함
요약하다
이 전략은 RSI, T3 및 ATR의 세 가지 지표의 장점을 통합하여 트렌드 판단과 위험 제어의 유기적 결합을 구현합니다. 단일 지표에 비해 판단 정확도가 높고 회수 제어가 좋은 것이 특징이며 신뢰할 수있는 트렌드 추적 전략입니다. 매개 변수 및 위험 제어 측면에서 최적화 할 여지가 있으며 전반적으로 권장되는 양적 거래 전략입니다.
Source
Pine
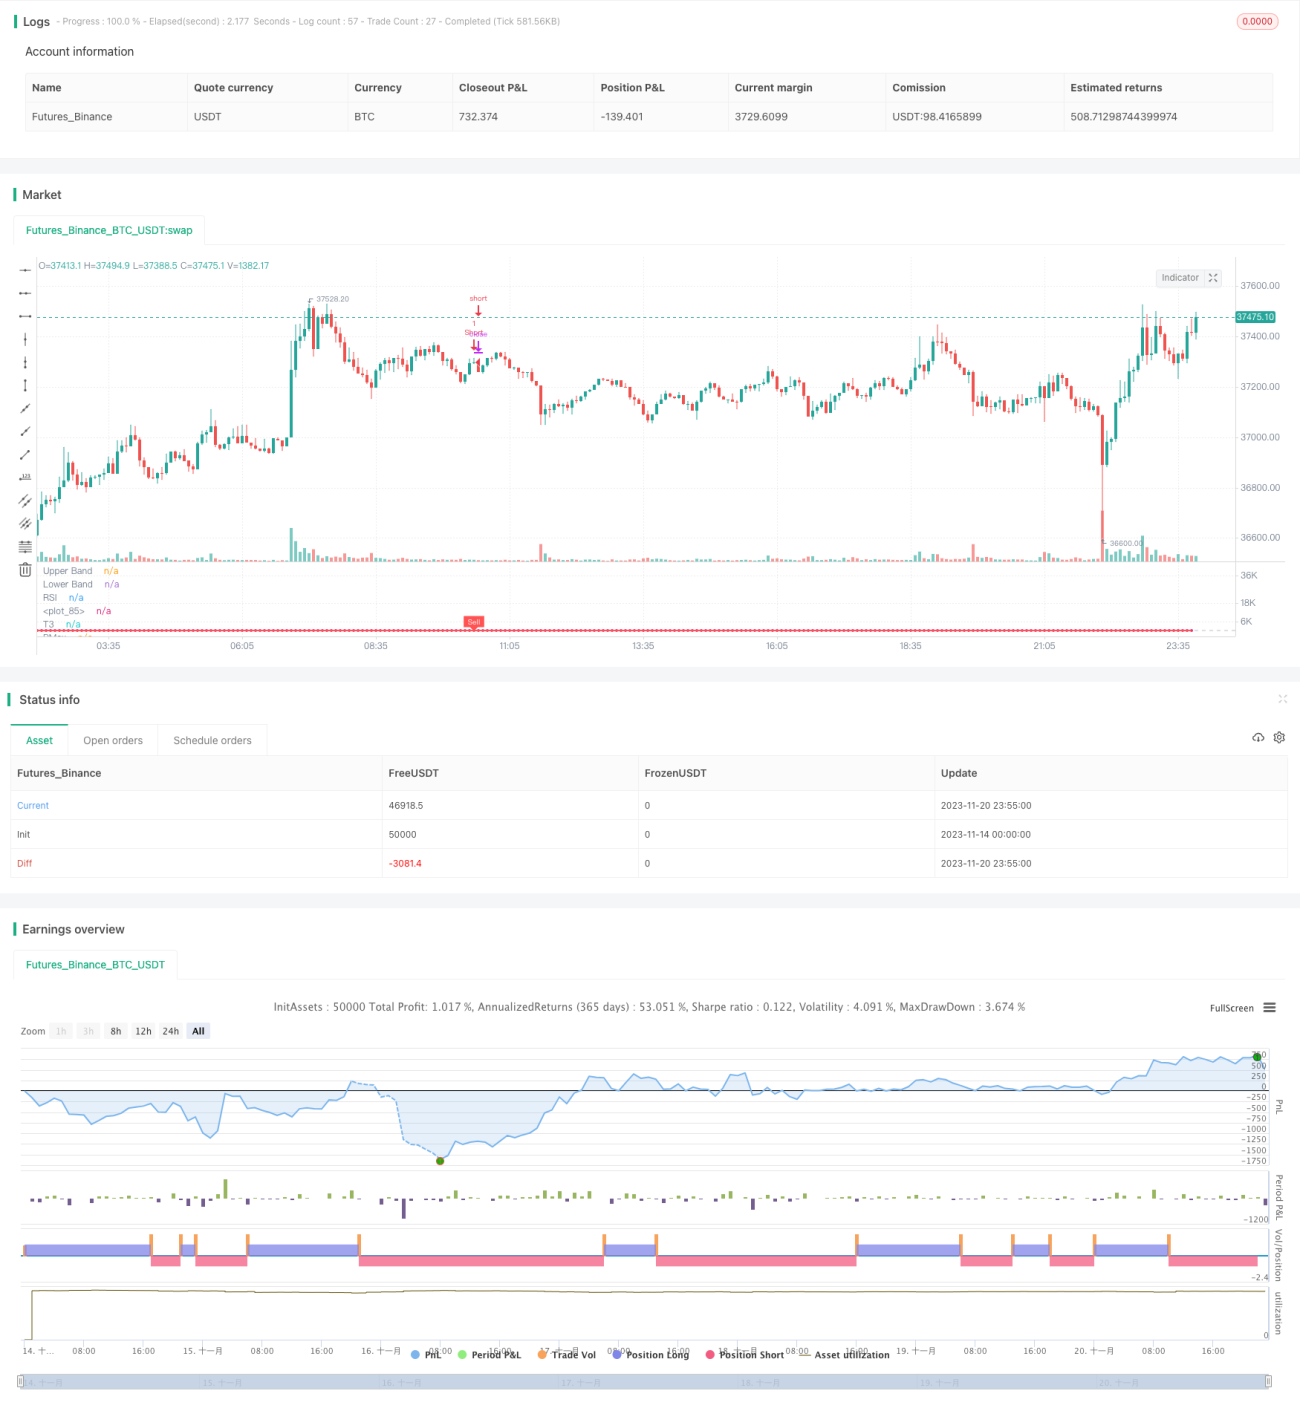
/*backtest
start: 2023-11-14 00:00:00
end: 2023-11-21 00:00:00
period: 5m
basePeriod: 1m
exchanges: [{"eid":"Futures_Binance","currency":"BTC_USDT"}]
*/

//@version=4
// This source code is subject to the terms of the Mozilla Public License 2.0 at https://mozilla.org/MPL/2.0/
// © KivancOzbilgic
//developer: @KivancOzbilgicStrategy parameters
Related strategies
Comment
All comments (0)
No data
- 1