
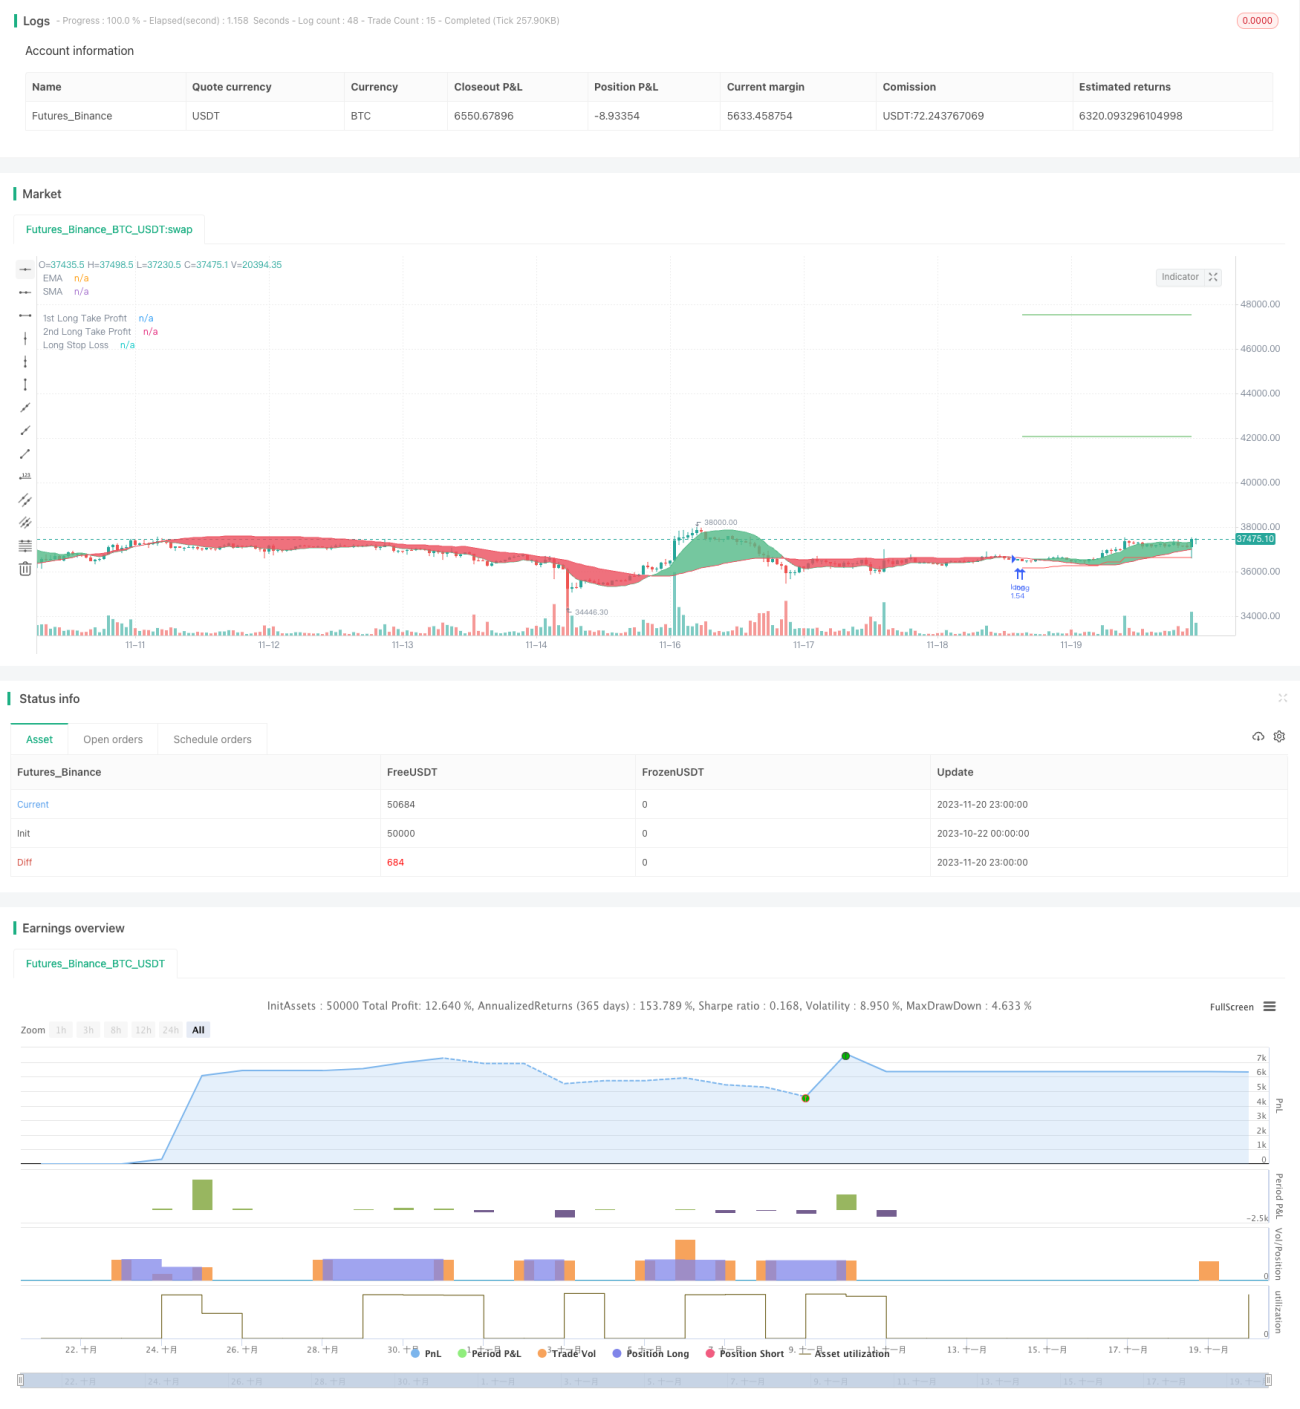
이 전략은 주로 BTC의 긴 라인 투자를 자동화하기 위해 사용된다. 쌍 EMA와 LSMA의 교차로 트렌드 방향을 판단하고 ATR 지표를 사용하여 동적 스톱로스를 계산하여 BTC의 다목적 트렌드를 효과적으로 추적한다.
25기 EMA와 100기 LSMA를 사용하여 쌍평평선을 구성하고, 이들의 교차는 시장의 추세를 판단하는 데 사용됩니다. EMA는 가격 변화에 빠르게 반응하고, LSMA는 파동의 가짜 돌파구를 니다.
빠른 EMA 위쪽에서 느린 LSMA를 통과할 때 여전히 상위 추세에 있다고 판단되면 더 많이 한다. 반대로 빠른 EMA 아래쪽에서 느린 LSMA를 통과할 때 공백으로 판단되면 평정한다.
입수 후, ATR 지표를 사용하여 계산된 동적 스톱로스는 지속적으로 조정하여 BTC의 상승 추세를 효과적으로 추적합니다. 구체적으로, 스톱 라인은 입수 가격으로 시작되며, 이후 매번 조정하면 고정 비율의 ATR 폭이 상향으로 이동합니다.
스톱 라인은 BTC의 상승으로 인한 불변을 효과적으로 차단하고, 스톱 포인트가 최신 가격에 너무 가까이 있으면 자주 스톱되는 것을 방지합니다. 또한, 전략은 더 많은 이익을 차단하기 위해 두 가지 다른 비율의 이동 스톱을 설정합니다.
이중평등선 판단을 통해 트렌드를 더 안정적으로 판단하여 잘못된 신호를 효과적으로 방지할 수 있다.
ATR 동적 추적 중지, 이익의 대부분을 잠금 할뿐만 아니라 자주 작은 중지 방지 할 수 있습니다.
다중의 거래가 종료되었든 아니든 간에, 평행선에서 탈퇴 신호가 발송될 때, 손해가 멈추고, 위험은 통제된다.
자동화 수준이 높고, 인적 개입이 필요없고, 실디 디스크가 오랫동안 작동할 수 있다.
하지만 여전히 중요한 뉴스에 주의를 기울여야 하며, 큰 손실을 피해야 합니다.
이중 평선 결합은 가짜 신호를 줄일 수 있지만, 진동상태에서는 완전히 피하기 어렵다.
ATR 매개 변수 설정이 잘못되면 손실 차단 효과에도 영향을 미치며, 다양한 품종에 따라 조정해야 한다.
평균선 주기가 불합리하거나 시간 내에 업데이트되지 않는 것도 신호의 지연을 유발할 수 있다.
서버의 안정성을 보장하고 자동 거래 중단으로 인한 비정상적인 정지 방지.
브린 띠와 같은 추세를 판단하는 더 많은 지표를 추가하거나, 기계 학습 모델을 사용하여 가격을 예측하는 것을 시도할 수 있습니다.
ATR 동적 중지 손실의 계산 방법은 조정 및 최적화하여 중지 손실을 더 부드럽게 할 수 있습니다.
거래량과 하루의 턴에 따라 FEATURE의 알림 메커니즘을 추가하여 중요한 뉴스 측면의 충격을 방지할 수 있습니다.
다른 화폐의 파라미터가 다르기 때문에 더 많은 역사 데이터를 사용하여 개인화 파라미터를 훈련시킬 수 있습니다.
이 전략은 전체적으로 매우 실용적인 BTC 자동 투자 프로그램이다. 쌍 EMA를 사용하여 큰 추세를 판단하는 것은 매우 신뢰할 수 있으며, ATR 추적 중지와 함께, 좋은 수익을 얻을 수 있으며, 유효 기간도 매우 길다. 매개 변수를 계속 최적화 조정함에 따라, 이 전략의 효과는 개선할 여지가 있으며, 실험적으로 검증할 가치가 있다.
// This source code is subject to the terms of the Mozilla Public License 2.0 at https://mozilla.org/MPL/2.0/
// © Wunderbit Trading
//@version=4
strategy("Automated Bitcoin (BTC) Investment Strategy", overlay=true, initial_capital=5000,pyramiding = 0, currency="USD", default_qty_type=strategy.percent_of_equity, default_qty_value=100, commission_type=strategy.commission.percent,commission_value=0.1)
//////////// Functions
Atr(p) =>
atr = 0.
Tr = max(high - low, max(abs(high - close[1]), abs(low - close[1])))
atr := nz(atr[1] + (Tr - atr[1])/p,Tr)
//TEMA
TEMA(series, length) =>
if (length > 0)
ema1 = ema(series, length)
ema2 = ema(ema1, length)
ema3 = ema(ema2, length)
(3 * ema1) - (3 * ema2) + ema3
else
na
tradeType = input("LONG", title="What trades should be taken : ", options=["LONG", "SHORT", "BOTH", "NONE"])
///////////////////////////////////////////////////
/// INDICATORS
source=close
/// TREND
trend_type1 = input("TEMA", title ="First Trend Line : ", options=["LSMA", "TEMA","EMA","SMA"])
trend_type2 = input("LSMA", title ="First Trend Line : ", options=["LSMA", "TEMA","EMA","SMA"])
trend_type1_length=input(25, "Length of the First Trend Line")
trend_type2_length=input(100, "Length of the Second Trend Line")
leadLine1 = if trend_type1=="LSMA"
linreg(close, trend_type1_length, 0)
else if trend_type1=="TEMA"
TEMA(close,trend_type1_length)
else if trend_type1 =="EMA"
ema(close,trend_type1_length)
else
sma(close,trend_type1_length)
leadLine2 = if trend_type2=="LSMA"
linreg(close, trend_type2_length, 0)
else if trend_type2=="TEMA"
TEMA(close,trend_type2_length)
else if trend_type2 =="EMA"
ema(close,trend_type2_length)
else
sma(close,trend_type2_length)
p3 = plot(leadLine1, color= #53b987, title="EMA", transp = 50, linewidth = 1)
p4 = plot(leadLine2, color= #eb4d5c, title="SMA", transp = 50, linewidth = 1)
fill(p3, p4, transp = 60, color = leadLine1 > leadLine2 ? #53b987 : #eb4d5c)
//Upward Trend
UT=crossover(leadLine1,leadLine2)
DT=crossunder(leadLine1,leadLine2)
// TP/ SL/ FOR LONG
// TAKE PROFIT AND STOP LOSS
long_tp1_inp = input(15, title='Long Take Profit 1 %', step=0.1)/100
long_tp1_qty = input(20, title="Long Take Profit 1 Qty", step=1)
long_tp2_inp = input(30, title='Long Take Profit 2%', step=0.1)/100
long_tp2_qty = input(20, title="Long Take Profit 2 Qty", step=1)
long_take_level_1 = strategy.position_avg_price * (1 + long_tp1_inp)
long_take_level_2 = strategy.position_avg_price * (1 + long_tp2_inp)
long_sl_input = input(5, title='stop loss in %', step=0.1)/100
long_sl_input_level = strategy.position_avg_price * (1 - long_sl_input)
// Stop Loss
multiplier = input(3.5, "SL Mutiplier", minval=1, step=0.1)
ATR_period=input(8,"ATR period", minval=1, step=1)
// Strategy
//LONG STRATEGY CONDITION
SC = input(close, "Source", input.source)
SL1 = multiplier * Atr(ATR_period) // Stop Loss
Trail1 = 0.0
Trail1 := iff(SC < nz(Trail1[1], 0) and SC[1] < nz(Trail1[1], 0), min(nz(Trail1[1], 0), SC + SL1), iff(SC > nz(Trail1[1], 0), SC - SL1, SC + SL1))
Trail1_high=highest(Trail1,50)
// iff(SC > nz(Trail1[1], 0) and SC[1] > nz(Trail1[1], 0), max(nz(Trail1[1], 0), SC - SL1),
entry_long=crossover(leadLine1,leadLine2) and Trail1_high < close
exit_long = close < Trail1_high or crossover(leadLine2,leadLine1) or close < long_sl_input_level
///// BACKTEST PERIOD ///////
testStartYear = input(2016, "Backtest Start Year")
testStartMonth = input(1, "Backtest Start Month")
testStartDay = input(1, "Backtest Start Day")
testPeriodStart = timestamp(testStartYear, testStartMonth, testStartDay, 0, 0)
testStopYear = input(9999, "Backtest Stop Year")
testStopMonth = input(12, "Backtest Stop Month")
testStopDay = input(31, "Backtest Stop Day")
testPeriodStop = timestamp(testStopYear, testStopMonth, testStopDay, 0, 0)
testPeriod() =>
time >= testPeriodStart and time <= testPeriodStop ? true : false
if testPeriod()
if tradeType=="LONG" or tradeType=="BOTH"
if strategy.position_size == 0 or strategy.position_size > 0
strategy.entry("long", strategy.long, comment="b8f60da7_ENTER-LONG_BINANCE_BTC/USDT_b8f60da7-BTC-Investment_4H", when=entry_long)
strategy.exit("TP1", "long", qty_percent=long_tp1_qty, limit=long_take_level_1)
strategy.exit("TP2", "long", qty_percent=long_tp2_qty, limit=long_take_level_2)
strategy.close("long", when=exit_long, comment="b8f60da7_EXIT-LONG_BINANCE_BTC/USDT_b8f60da7-BTC-Investment_4H" )
// LONG POSITION
plot(strategy.position_size > 0 ? long_take_level_1 : na, style=plot.style_linebr, color=color.green, linewidth=1, title="1st Long Take Profit")
plot(strategy.position_size > 0 ? long_take_level_2 : na, style=plot.style_linebr, color=color.green, linewidth=1, title="2nd Long Take Profit")
plot(strategy.position_size > 0 ? Trail1_high : na, style=plot.style_linebr, color=color.red, linewidth=1, title="Long Stop Loss")