듀얼 트랙 시스템 모멘텀 트레이딩 전략

[trans]
개요
이 전략은 MACD와 Stoch RSI 두 가지 지표를 조합하여 트렌드 추적과 오버로 오버 구매 판단을 가능하게 하는 쌍로 거래 시스템을 구축한다. 전략은 일선과 4 시간선에서 동시에 지표를 구축하여 여러 시간 프레임의 판단을 가능하게 하며, 잘못된 판단의 확률을 감소시킨다.
전략 원칙
전략 포트폴리지는 MACD와 Stoch RSI 두 가지 다른 유형의 기술 지표를 사용하여 구성합니다. MACD는 가격 변화의 속도를 판단하는 차동 지표이며, Stoch RSI는 가격의 상대적으로 강하다는 것을 판단하는 과잉 구매 과잉 판매 지표입니다.
전략은 먼저 MACD와 Stoch RSI 지표를 일선과 4 시간선에서 각각 구축하여 트렌드 및 오버 바이 오버 세를 판단합니다. 두 시간 주기 지표가 동시에 구매 / 판매 신호를 발송 할 때, 해당 구매 / 판매 작업을 수행합니다.
구체적으로, MACD 지표, DIF 라인 및 DEA 라인을 구성하여 골드 포크 사다리를 판단합니다. Stoch RSI 지표, K 라인 및 D 라인을 구성하여 골드 포크 사다리를 판단합니다. 두 개의 지표 그룹이 동시에 골드 포크 할 때 구매 신호를 생성하고 동시에 사다리가있을 때 판매 신호를 생성합니다.
따라서, 전략적 종합적인 2차 지표와 다중 시간 프레임 판단을 사용하여 가격 변화의 속도와 상대적 강점을 종합적으로 판단하여 의사 결정의 정확성을 높이고 더 나은 수익을 얻을 수 있습니다.
우위 분석
이 전략에는 다음과 같은 장점이 있습니다.
- 쌍방향 지표의 조합, 전체적인 판단, 의사 결정의 정확성 향상
- 다중 시간 프레임으로 판단을 줄여라
- 트렌드 추적과 과매매 판단을 사용하여 가격 변화의 속도와 상대적인 강점을 종합적으로 고려합니다.
- 지표 매개 변수는 다양한 품종과 시장 환경에 맞게 조정할 수 있습니다.
- 코드 구조가 명확하고, 이해하기 쉽고, 확장할 수 있습니다.
위험 분석
이 전략에는 몇 가지 위험도 있습니다.
- 시장의 시스템적 위험은 완전히 피할 수 없습니다.
- 부적절한 지표 매개 변수 설정으로 인해 거래가 빈번하거나 기회를 놓칠 수 있습니다.
- 쌍선 지표가 동시에 잘못된 신호를 보내는 확률이 존재하지만 단일 지표보다 낮습니다.
- 시장의 급격한 변화에 대처할 수 없습니다.
대책:
- 최적화 매개 변수, 거래 조건 조정, 잘못된 판단 감소
- 더 많은 지표와 결합하여 판단력을 높여라
- 단편적 손실 위험을 통제하기 위한 손실 방지 전략을 강화
최적화 방향
이 전략은 다음과 같은 부분에서 최적화될 수 있습니다.
- 더 많은 지표를 조합하여 다중 지표 전략을 구축하십시오.
- 기계 학습 알고리즘을 추가하여 동적 변수 최적화를 구현합니다.
- 감정 지표, 뉴스 면 등과 더 많은 요소를 결합하여 시장 상황을 판단합니다.
- 더 많은 손실을 막고, 더 많은 돈을 벌고, 더 나은 재무 관리
- 더 많은 종류의 거래를 확대하고 더 나은 거래 기회를 찾아라
요약하다
이 전략은 이중 트랙 지표와 다중 시간 프레임 판단의 조합을 사용하여 가격 변화 속도 및 상대적 강점을 종합적으로 판단하여 시장 추세를 효과적으로 확보하고 단일 지표의 잘못된 판단 결점을 개선 할 수 있습니다. 또한 매개 변수를 조정하는 유연성, 이해 및 확장하기 쉬운 등의 장점을 가지고 있습니다. 이후 다중 지표 조합, 동적 매개 변수 최적화, 감정 지표 도입 등의 방법으로 확장 및 최적화하여 전략의 성능을 더욱 향상시킬 수 있습니다.
||
Overview
This strategy combines the MACD and Stoch RSI indicators to build a dual-rail trading system for trend tracking and oversold/overbought judgment. The strategy also builds indicators on the daily and 4-hour timeframes to make multi-timeframe judgments to reduce misjudgment probability.
Strategy Principle
The strategy combines the MACD and Stoch RSI indicators, which are different types of technical indicators, for configuration. MACD is a momentum indicator that judges price change velocity; Stoch RSI is an overbought/oversold indicator that judges relative price strength.
The strategy first constructs the MACD and Stoch RSI indicators on the daily and 4-hour timeframes respectively for trend and overbought/oversold judgments. When signals are triggered on both timeframes, corresponding buy/sell operations are performed.
Specifically, the MACD indicator is constructed with the DIF and DEA lines forming golden/dead crosses for judgment; the Stoch RSI indicator is constructed with the K and D lines forming golden/dead crosses for judgment. When both indicator pairs have golden crosses, buy signals are generated; when both have dead crosses, sell signals are generated.
Thus, by comprehensively applying the dual-indicator system and multi-timeframe judgments, the strategy judges price velocity and relative strength thoroughly, which helps improve decision accuracy and gain better returns.
Advantage Analysis
This strategy has the following advantages:
- Combining dual-indicator system for comprehensive judgment and higher decision accuracy
- Applying multi-timeframe to reduce misjudgment probability
- Adopting trend tracking and overbought/oversold judgment for consideration of both price velocity and relative strength
- Flexible indicator parameters adjustable for different products and market environments
- Clean code structure easy to understand and expand
Risk Analysis
There are also some risks with this strategy:
- There exist systemic market risks that cannot be fully avoided
- Inappropriate indicator parameter settings may lead to overtrading or missing opportunities
- Dual indicators may still give concurrent wrong signals, but less likely than single ones
- Unable to cope with drastic market changes like black swan events
Countermeasures:
- Optimize parameters and adjust trading conditions to reduce misjudgments
- Incorporate more indicators for combined judgments
- Add stop loss mechanisms to control single loss risk
Optimization Directions
This strategy can also be improved in the following aspects:
- Incorporate more indicators for multi-indicator strategies
- Add machine learning algorithms for dynamic parameter optimization
- Combine sentiment indicators, news etc. for more comprehensive market condition judgments
- Add stop loss, take profit strategies to optimize money management
- Expand to more trading products to discover better opportunities
Conclusion
By combined application of the dual-indicator system and multi-timeframe judgments, this strategy judges price velocity and relative strength thoroughly, which can effectively capture market trends and improve deficiencies of single indicators. It also has advantages like flexible parameter tuning, easy understanding and expansion. Further expansions by multi-indicator combination, dynamic parameter optimization, sentiment indicator incorporation etc. can help boost strategy performance.
[trans]
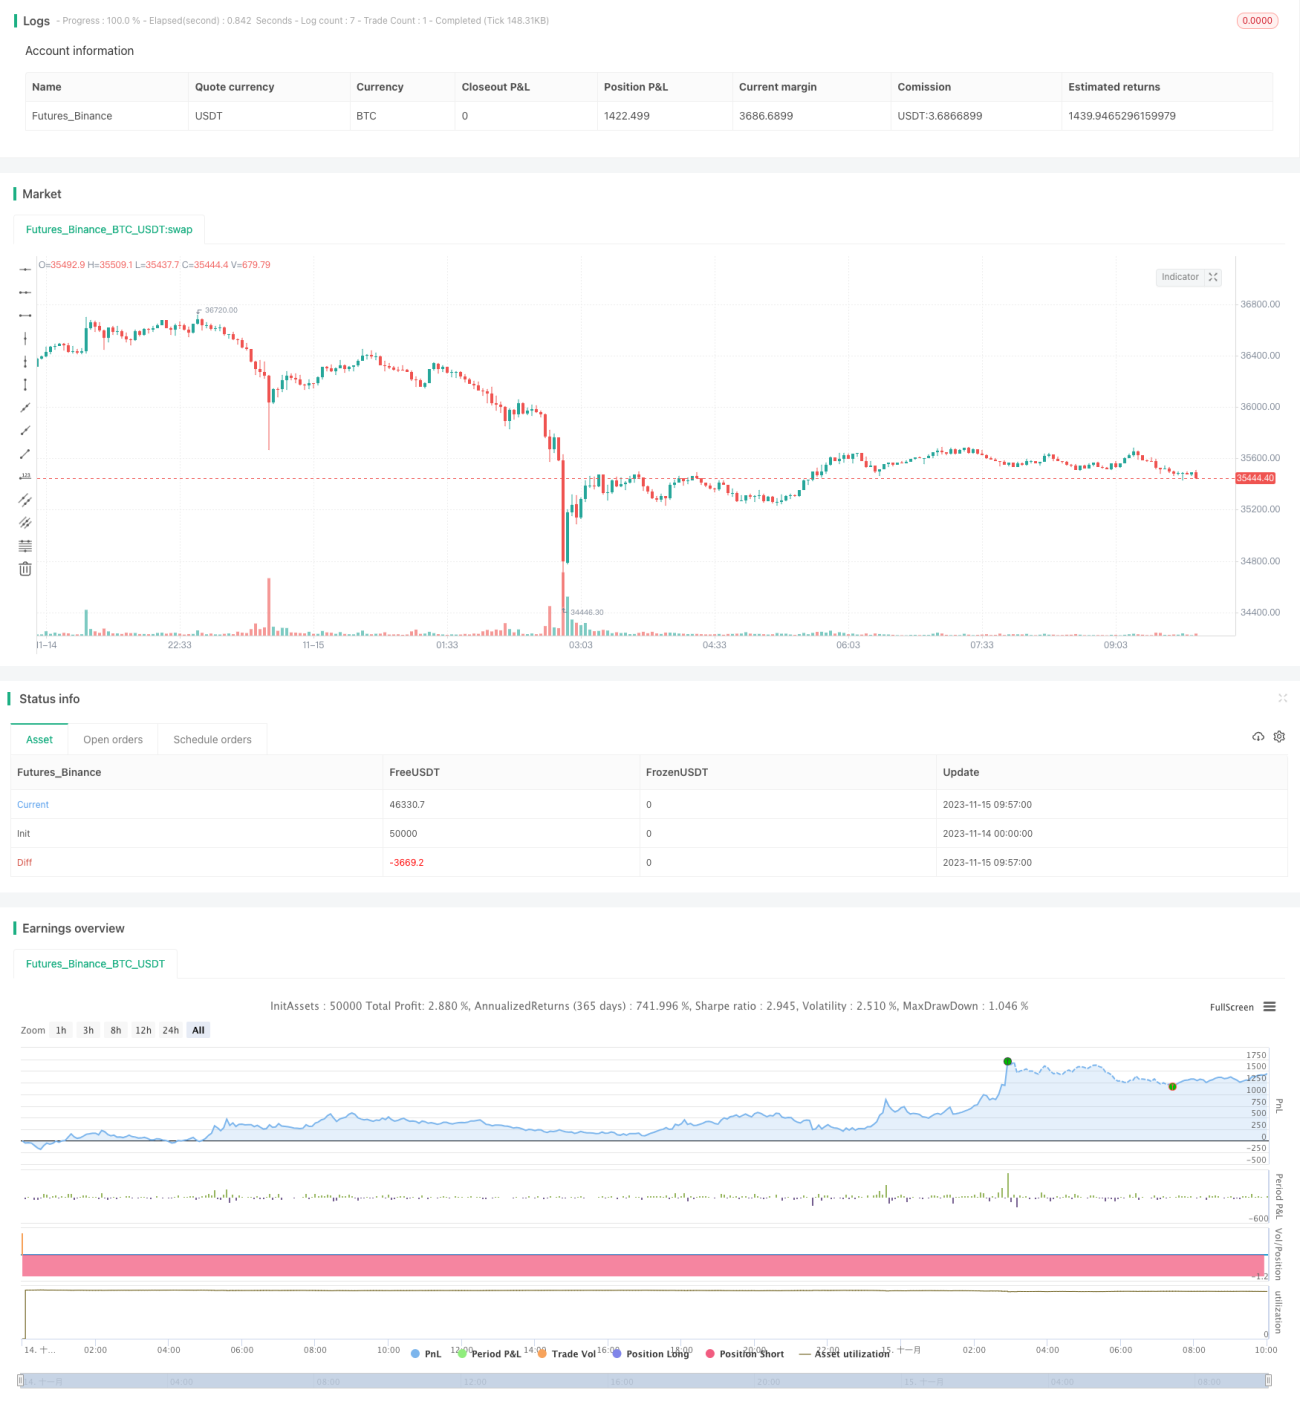
/*backtest
start: 2023-11-14 00:00:00
end: 2023-11-15 10:00:00
period: 3m
basePeriod: 1m
exchanges: [{"eid":"Futures_Binance","currency":"BTC_USDT"}]
*/

//@version=2
strategy(title='[RS]Khizon (UWTI) Strategy V0', shorttitle='K', overlay=false, pyramiding=0, initial_capital=100000, currency=currency.USD)
//  ||  Inputs:
macd_src = input(title='MACD Source:', defval=close)- 1