모멘텀과 트렌드 판단을 결합한 다중 요인 양적 거래 전략

1
Follow
1778
Followers
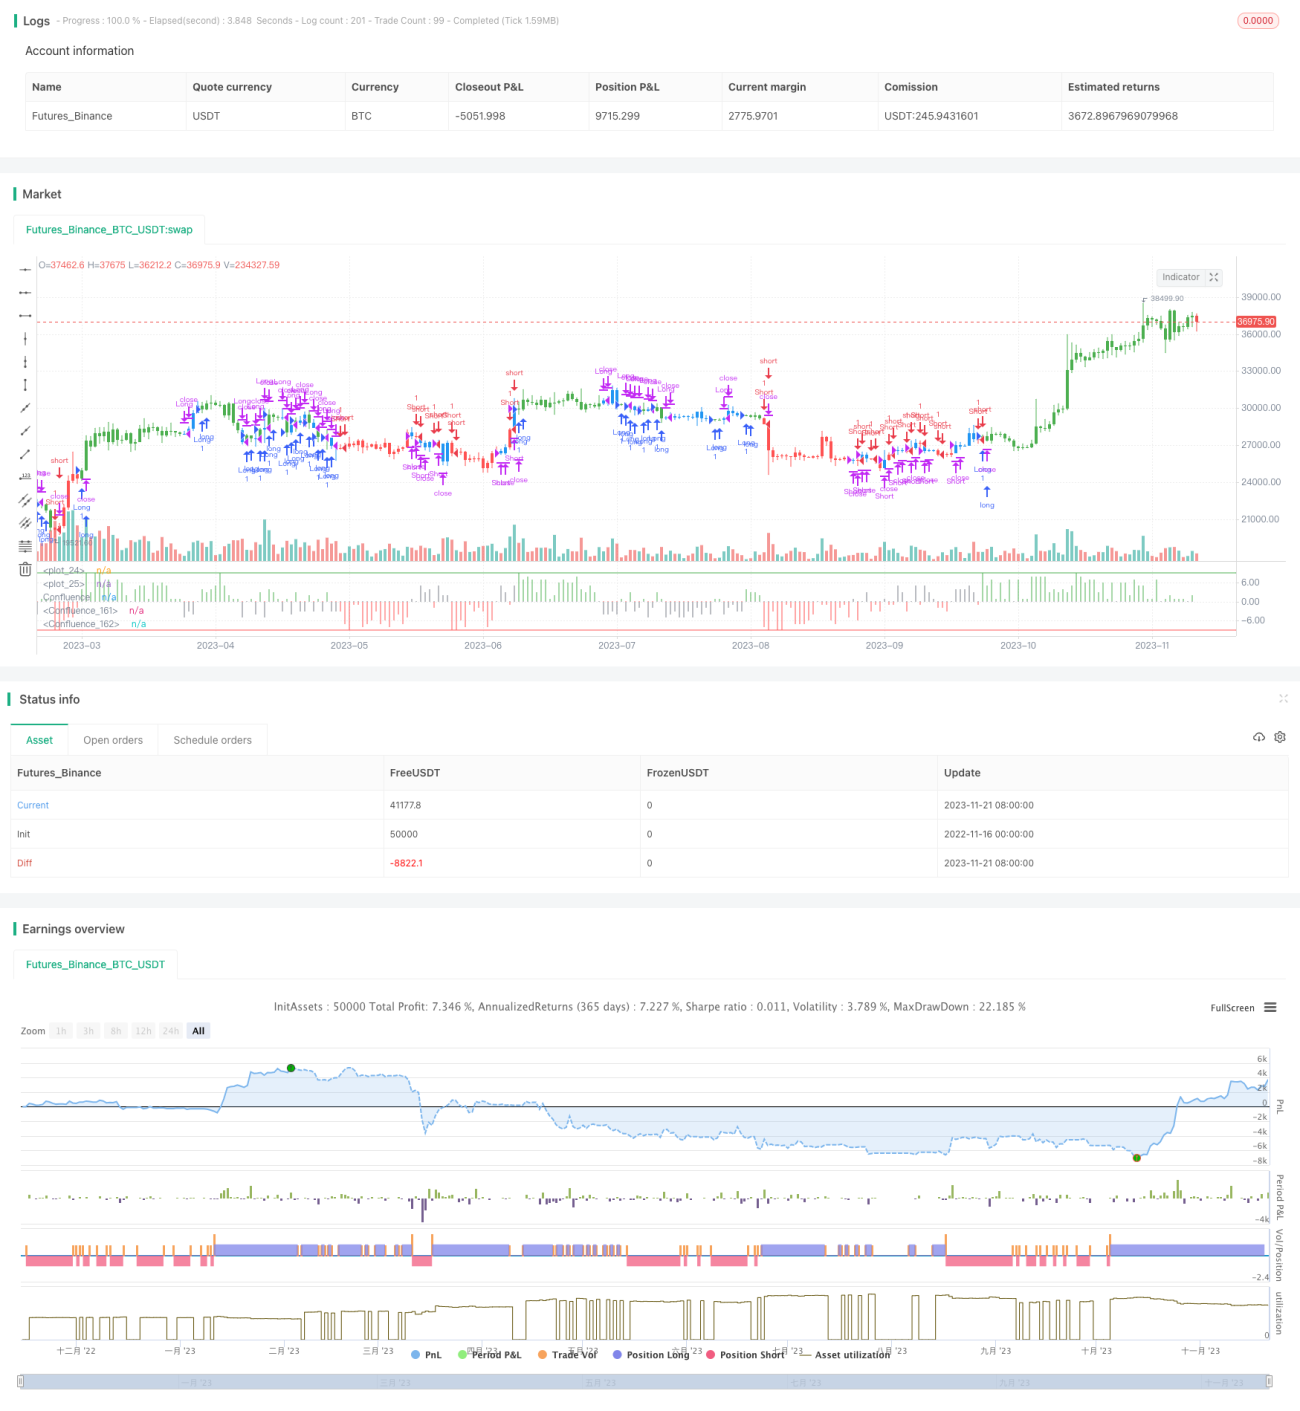
개요
이 전략은 동력 지표와 경향 지표를 결합한 다인자 판단형 수치 거래 전략이다. 전략은 여러 평균의 수학적 조합을 계산하여 시장의 전반적인 경향과 동력 방향을 판단하고, 하락 조건에 따라 거래 신호를 낸다.
전략 원칙
- 여러 그룹의 평균과 동력 지표를 계산한다
- 하모닉스 평균, 단기 평균, 중기 평균, 장기 평균과 같은 여러 그룹의 평균을 계산합니다.
- 가격 변화 경향을 반영하는 각 평균 사이의 차이를 계산합니다.
- 각 평균의 1차 계수를 계산하여 가격 변화의 동력을 반영합니다.
- 동향을 판단하기 위한 시노드/아스노드 지표를 계산합니다.
- 종합 판단 거래 신호
- 동력 지표, 트렌드 지표 등의 여러 요인을 가중계로 계산합니다.
- 현재 시장을 판단하기 위한 결과값은 시점과 매우 가깝습니다.
- 이 신호는 상위 100달러를 차지하는 것을 의미합니다.
우위 분석
- 다중 요소 판단, 신호 정확도 향상
- 가격, 트렌드, 동력 등 여러 요소들을 종합적으로 고려하는 것
- 다른 요소에 다른 무게를 부여할 수 있습니다.
- 다른 시장에 적응할 수 있는 변수
- 평균 변수, 거래 구역 간 경계를 사용자 정의할 수 있습니다.
- 다른 주기 및 시장 환경에 적응
- 코드 구조는 명확하고 이해하기 쉽습니다.
- 명명규정, 코멘트 완전
- 2차 개발 및 최적화
위험 분석
- 변수를 최적화하기 어려운 경우
- 가장 최적의 변수를 찾기 위해 많은 양의 역사 데이터를 추적해야 합니다.
- 거래 빈도가 너무 높을 수 있습니다.
- 여러 요소의 조합으로 인해 과도한 거래가 발생할 수 있습니다.
- 효과와 시장 관련성이 높다
- 트렌드를 판단하는 전략, 비이성적인 행동의 영향을 받기 쉬운 방법
최적화 방향
- Stop Loss 로직을 추가합니다.
- 비합리적인 행동으로 인한 더 큰 손실을 피할 수 있습니다.
- 최적화 변수 설정
- 전략적 안정성을 높이기 위한 최적의 요소 조합을 찾는 것
- 기계 학습 요소를 추가합니다.
- 현재 시장 상황을 판단하고 전략적 의사결정을 지원하기 위해 딥러닝을 사용합니다.
요약하다
이 전략은 동력 지표와 트렌드 지표의 다인자 조합을 통해 시장 상태를 판단하고 설정된 임계값에 따라 거래 신호를 발송한다. 전략의 장점은 구성성이 강하고, 다양한 시장 환경에 적합하며, 이해하기 쉽다는 것이다. 전략의 단점은 매개 변수를 최적화하는 데 어려움이 많고, 거래 빈도가 너무 높고, 효과는 시장과 관련이 강하다. 향후에는 중지 손실, 매개 변수 최적화 및 기계 학습 등의 수단을 추가하여 추가적으로 최적화 할 수 있다.
Source
Pine
/*backtest
start: 2022-11-16 00:00:00
end: 2023-11-22 00:00:00
period: 1d
basePeriod: 1h
exchanges: [{"eid":"Futures_Binance","currency":"BTC_USDT"}]
*/

//@version=2
////////////////////////////////////////////////////////////
//  Copyright by HPotter v1.0 14/03/2017
// This is modified version of Dale Legan's "Confluence" indicator written by Gary Fritz.Strategy parameters
Related strategies
Comment
All comments (0)
No data
- 1