개인화된 모멘텀 트레이딩 전략


생성 날짜: 2023-11-23 15:18:27 마지막으로 수정됨: 2023-11-23 15:18:27
복사: 0 클릭수: 611
avatar of ChaoZhang ChaoZhang
1
집중하다
1617
수행원

개인화된 모멘텀 트레이딩 전략

개요

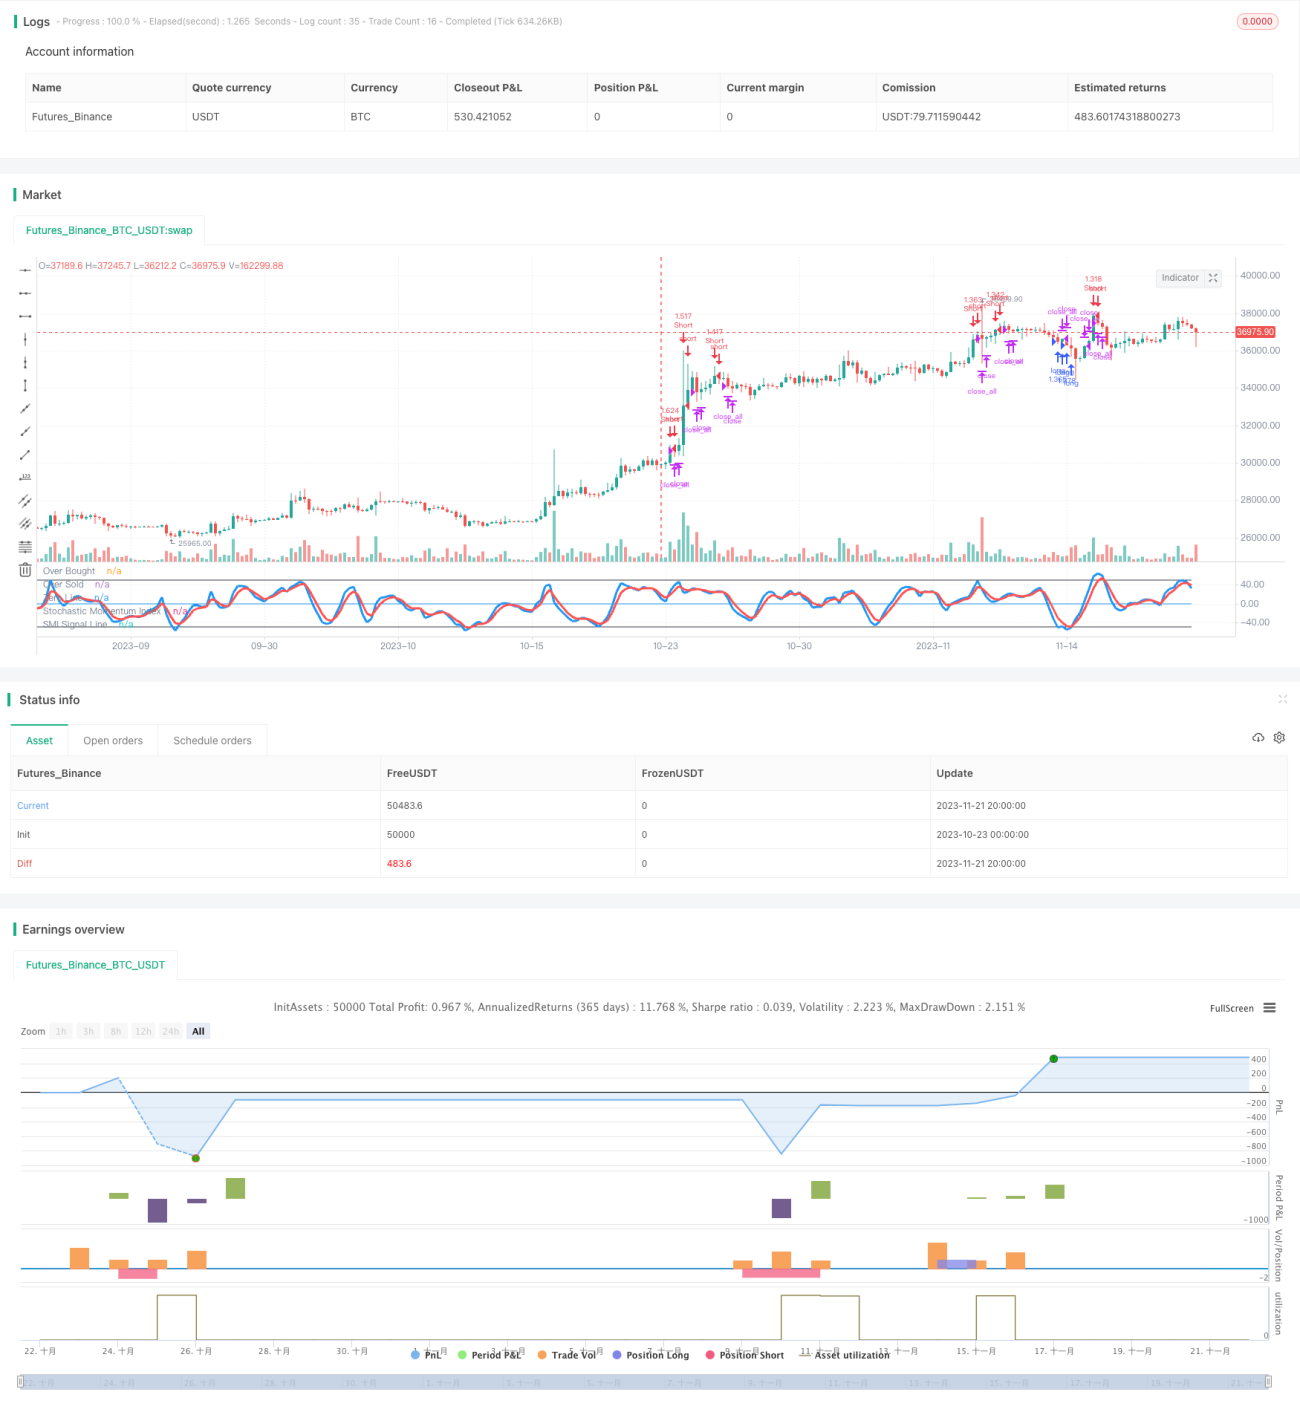
이것은 동력 지표와 K선 엔티티 필터링을 결합한 개인화 거래 전략이다. 그것은 무작위 동력 지표, 빠른 RSI 및 K선 엔티티 필터링을 종합적으로 사용하는 3 가지 기술 지표를 사용하여 동력 돌파를 주요하게 구현하고, 과매도 과매도 전략을 고려한다.

전략 원칙

이 전략은 다음의 세 가지 지표를 사용하여 거래 신호를 판단합니다.

  1. 무작위 동력 지수 ((SMI): K선 실물 간격과 종점 가격의 상대적 위치를 결합하여 가격 동력이 강하다는 것을 판단한다. SMI 상의 경계선을 통과하면 구매 신호가 발생하고, 아래의 경계선을 통과하면 판매 신호가 발생한다.

  2. 빠른 RSI ((7일선): 가격의 오버 바이 오버 셀 상태를 판단한다. RSI가 20보다 낮으면 오버 바이에 대한 구매 신호가 발생하고, 80보다 높으면 오버 바이에 대한 판매 신호가 발생한다.

  3. K선 엔티티 필터: 10일 동안의 평균 K선 엔티티 크기를 계산하고, 오늘 K선 엔티티가 그 평균값의 1/3을 초과할 때 유효하며, 무효 신호를 피한다.

이 전략은 먼저 SMI와 RSI의 신호를 판단하고, 그 중 하나의 지표의 신호 요구사항을 충족하면, K선 엔티티 필터링과 결합하여 그 신호가 유효한지를 판단하고, 유효한 경우 거래 신호를 생성한다.

우위 분석

이 전략은 다음과 같은 장점을 가지고 있습니다.

  1. 여러 지표가 합쳐져 판단이 더 정확하고 안정적입니다.

  2. K선 엔티티 필터를 추가하여 무효 신호를 피하십시오.

  3. 트렌드 반전 지점에서 신호를 잡는 것이 더 쉬워집니다.

  4. 두 방향으로 거래하면 수익이 늘어나죠.

  5. 일부 거래 포지션을 사용해서 한 거래에 과도한 손실을 피한다.

위험 분석

이 전략에는 몇 가지 위험도 있습니다.

  1. 지표의 작용에 따라, 잘못된 신호가 발생하여 손실이 발생할 수 있다. 매개 변수 최적화를 통해 잘못된 신호를 줄일 수 있다.

  2. 일부 포지션 거래는 각 방향의 트렌드 기회를 충분히 활용할 수 없습니다. 거래 포지션을 확대하여 더 높은 수익을 얻을 수 있습니다.

  3. SMI는 주요 지표로서, 파라미터 설정에 민감하며, 잘못 설정하면 거래 기회를 놓치거나 잘못된 신호를 증가시킬 수 있다.

  4. 다중공간 쌍방향 거래, 거래 빈도, 거래비용 증가.

최적화 방향

이 전략은 다음과 같은 방향으로 더 개선될 수 있습니다.

  1. SMI와 RSI의 변수를 최적화하여 최적의 변수 조합을 찾습니다.

  2. 포지션 확대와 포지션 관리 메커니즘을 추가하여 트렌드에서 더 높은 수익을 얻을 수 있습니다.

  3. 단편적 손실 위험을 줄이기 위한 손실을 막는 전략을 늘리십시오.

  4. 더 많은 지표와 함께 신호의 신뢰성을 판단하여 잘못된 신호를 줄일 수 있다.

  5. 효율적인 계약으로 거래 비용을 절감할 수 있습니다.

요약하다

이 전략은 SMI, 빠른 RSI 및 K선 엔티티 필터링의 3 가지 기술 지표를 통합하여, 초과 구매와 초과 판매를 고려하는 동력 중심의 개인화 거래 전략을 구현합니다. 그것은 정확한 판단, 효과적인 신호를 식별하고 초과 구매와 초과 판매 및 초과 거래와 같은 장점을 가지고 있습니다. 또한 일부 파라미터 민감성이 있으며, 추세를 충분히 활용하지 못하고, 동작 빈도와 같은 위험이 있습니다.

전략 소스 코드
/*backtest
start: 2023-10-23 00:00:00
end: 2023-11-22 00:00:00
period: 6h
basePeriod: 15m
exchanges: [{"eid":"Futures_Binance","currency":"BTC_USDT"}]
*/

//Noro
//2018

//@version=2
strategy(title = "Noro's Stochastic Strategy v1.2", shorttitle = "Stochastic str 1.2", overlay = false, default_qty_type = strategy.percent_of_equity, default_qty_value = 100, pyramiding = 0)

//Settings 
needlong = input(true, defval = true, title = "Long")
needshort = input(true, defval = true, title = "Short")
usemar = input(false, defval = false, title = "Use Martingale")
capital = input(100, defval = 100, minval = 1, maxval = 10000, title = "Capital, %")
usesmi = input(true, defval = true, title = "Use SMI Strategy")
usersi = input(true, defval = true, title = "Use RSI Strategy")
usebod = input(true, defval = true, title = "Use Body-Filter")
a = input(5, "SMI Percent K Length")
b = input(3, "SMI Percent D Length")
limit = input(50, defval = 50, minval = 1, maxval = 100, title = "SMI Limit")
fromyear = input(2017, defval = 2017, minval = 1900, maxval = 2100, title = "From Year")
toyear = input(2100, defval = 2100, minval = 1900, maxval = 2100, title = "To Year")
frommonth = input(01, defval = 01, minval = 01, maxval = 12, title = "From Month")
tomonth = input(12, defval = 12, minval = 01, maxval = 12, title = "To Month")
fromday = input(01, defval = 01, minval = 01, maxval = 31, title = "From day")
today = input(31, defval = 31, minval = 01, maxval = 31, title = "To day")

//Fast RSI
fastup = rma(max(change(close), 0), 7)
fastdown = rma(-min(change(close), 0), 7)
fastrsi = fastdown == 0 ? 100 : fastup == 0 ? 0 : 100 - (100 / (1 + fastup / fastdown))

//Stochastic Momentum Index
ll = lowest (low, a)
hh = highest (high, a)
diff = hh - ll
rdiff = close - (hh+ll)/2
avgrel = ema(ema(rdiff,b),b)
avgdiff = ema(ema(diff,b),b)
SMI = avgdiff != 0 ? (avgrel/(avgdiff/2)*100) : 0
SMIsignal = ema(SMI,b)

//Lines
plot(SMI, color = blue, linewidth = 3, title = "Stochastic Momentum Index")
plot(SMIsignal, color = red, linewidth = 3, title = "SMI Signal Line")
plot(limit, color = black, title = "Over Bought")
plot(-1 * limit, color = black, title = "Over Sold")
plot(0, color = blue, title = "Zero Line")

//Body Filter
nbody = abs(close - open)
abody = sma(nbody, 10)
body = nbody > abody / 3 or usebod == false

//Signals
up1 = SMI < -1 * limit and close < open and body and usesmi
dn1 = SMI > limit and close > open and body and usesmi
up2 = fastrsi < 20 and close < open and body and usersi
dn2 = fastrsi > 80 and close > open and body and usersi
exit = ((strategy.position_size > 0 and close > open) or (strategy.position_size < 0 and close < open)) and body

//Trading
profit = exit ? ((strategy.position_size > 0 and close > strategy.position_avg_price) or (strategy.position_size < 0 and close < strategy.position_avg_price)) ? 1 : -1 : profit[1]
mult = usemar ? exit ? profit == -1 ? mult[1] * 2 : 1 : mult[1] : 1
lot = strategy.position_size == 0 ? strategy.equity / close * capital / 100 * mult : lot[1]

if up1 or up2
    if strategy.position_size < 0
        strategy.close_all()
        
    strategy.entry("long", strategy.long, needlong == false ? 0 : lot, when=(time > timestamp(fromyear, frommonth, fromday, 00, 00) and time < timestamp(toyear, tomonth, today, 23, 59)))

if dn1 or dn2
    if strategy.position_size > 0
        strategy.close_all()
        
    strategy.entry("Short", strategy.short, needshort == false ? 0 : lot, when=(time > timestamp(fromyear, frommonth, fromday, 00, 00) and time < timestamp(toyear, tomonth, today, 23, 59)))
    
if time > timestamp(toyear, tomonth, today, 23, 59) or exit
    strategy.close_all()