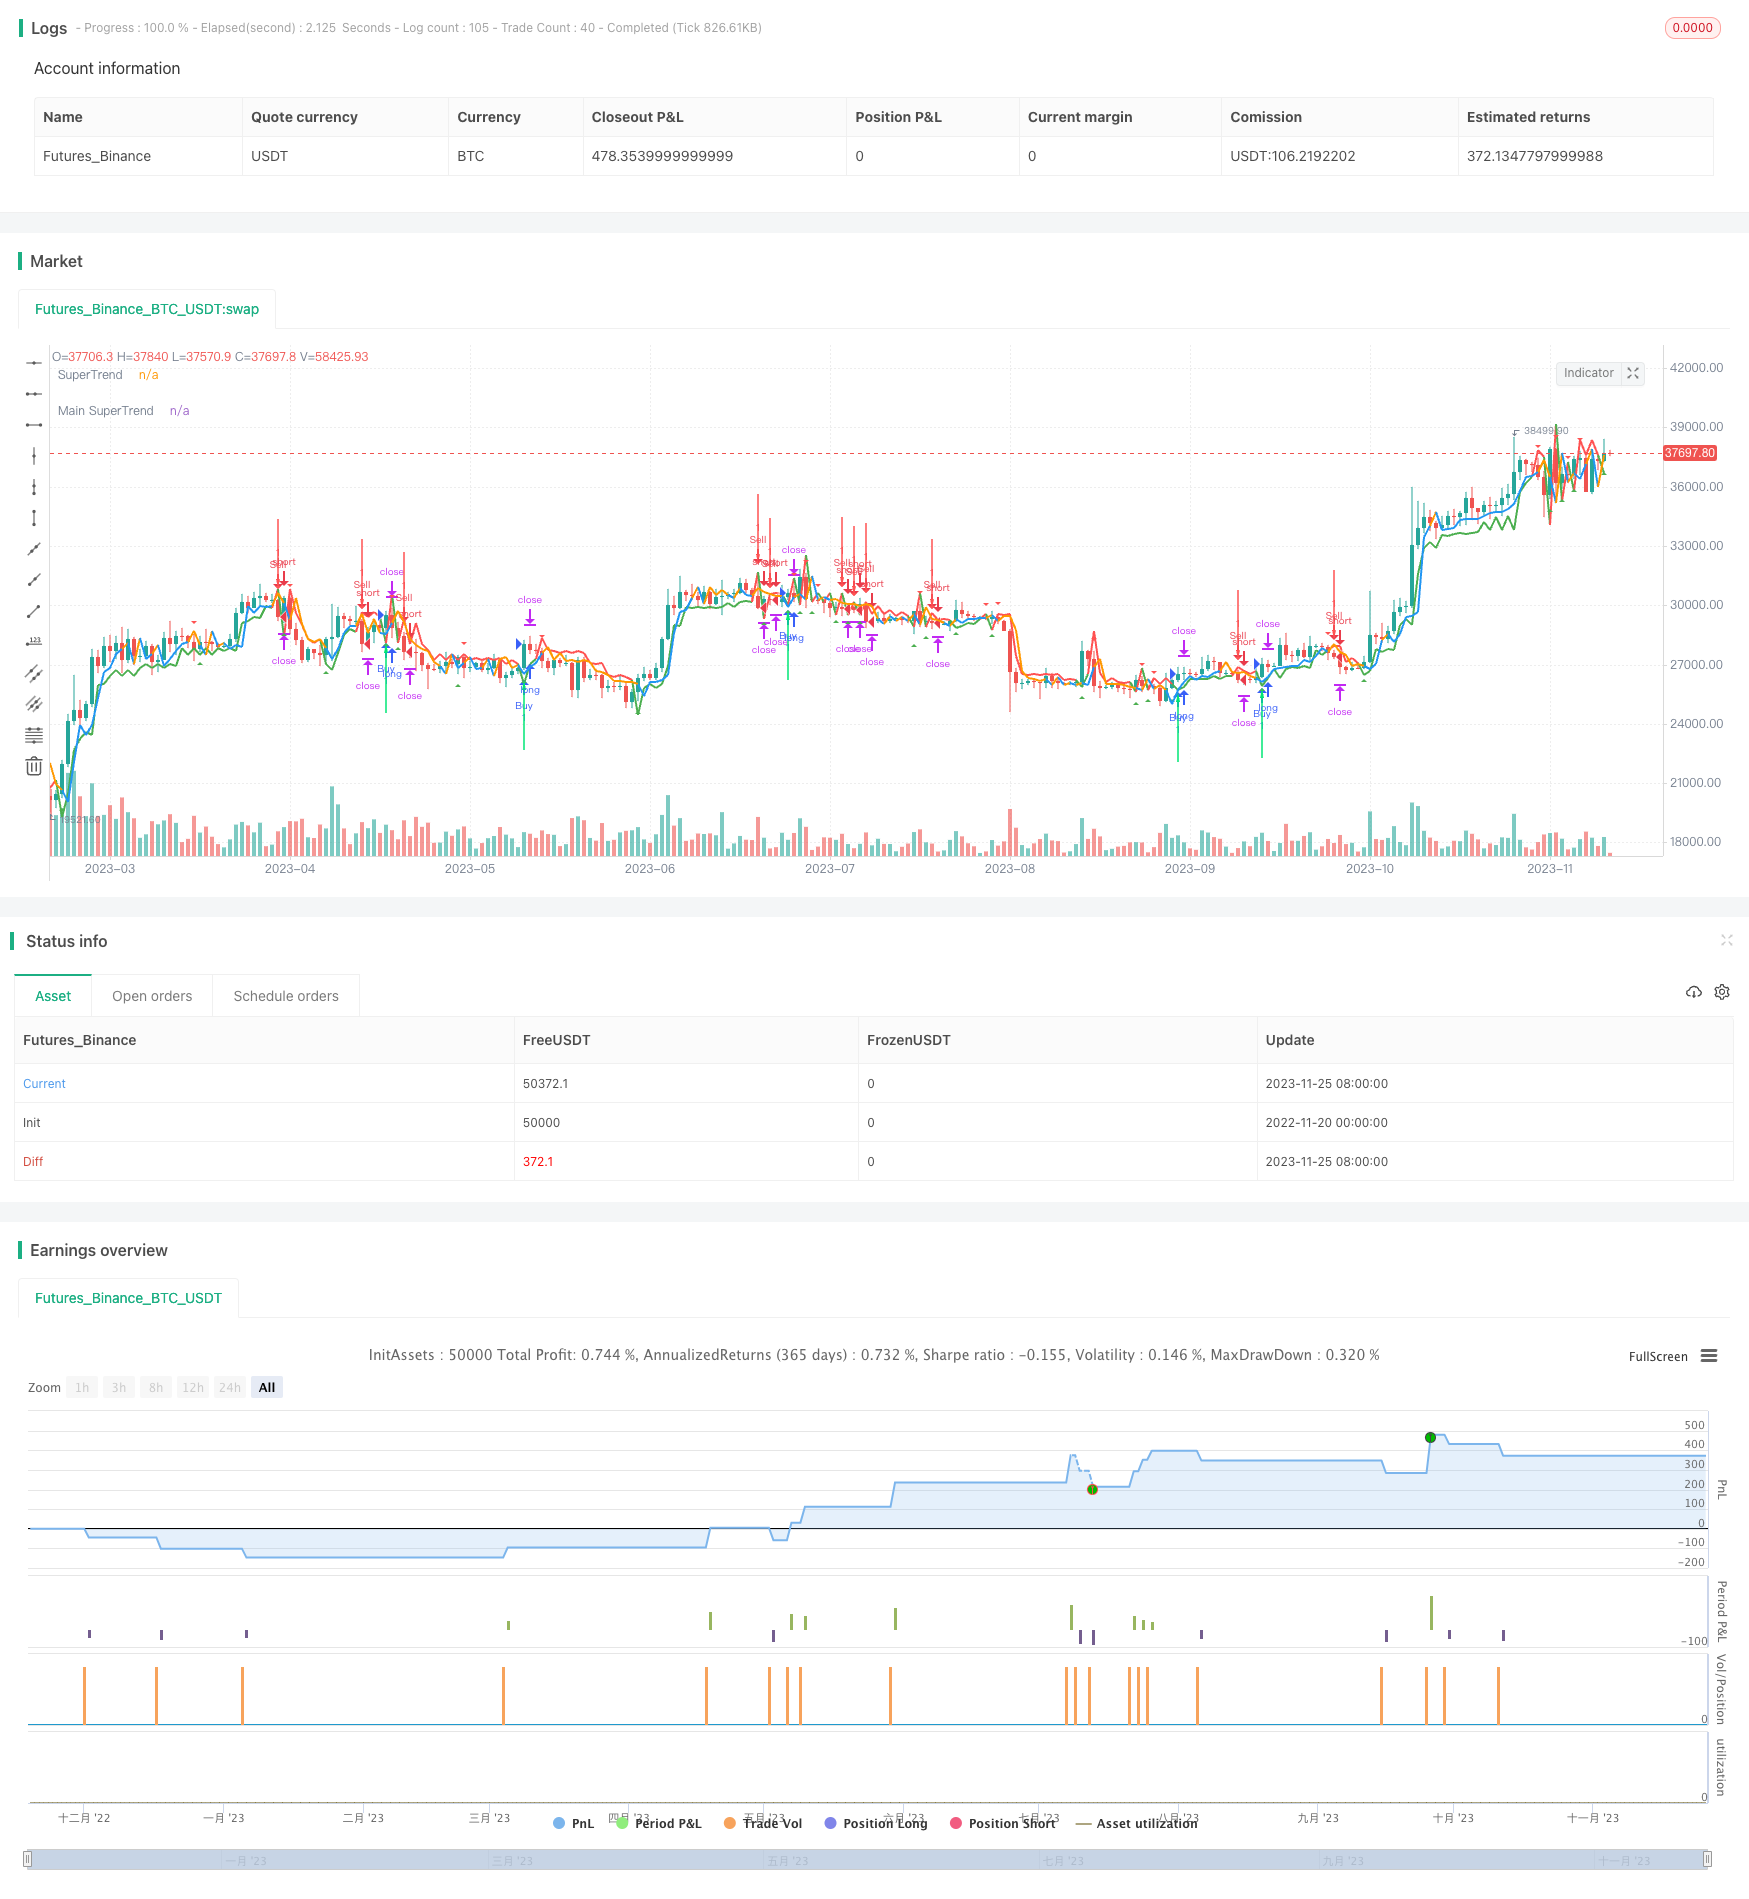
개요
쌍평평선 흔들림 돌파 전략은 두 개의 다른 주기의 평균선을 계산하여 통로를 형성하여 가격 흔들림 움직임을 판단한다. 가격이 통로를 돌파 할 때 거래 신호를 형성한다. 이 전략은 동시에 시장의 주류 움직임 판단과 결합하여 잘못된 돌파를 방지한다.
전략 원칙
이 전략은 주로 두 개의 이동평균선을 통해 상하 통로를 형성하며, 통로의 범위는 평균 실제 변동 범위 ATR에 의해 결정된다. 구체적으로, 전략은 주로 다음과 같은 단계를 포함한다:
두 개의 평균선을 계산, 평균선 1은 짧은 주기, 평균선 2은 긴 주기. 평균선 1은 현재 가격 경향을 반영, 평균선 2는 주류 가격 경향을 반영.
평균선 1 위에 하나씩 ATR이 형성되는 통로로, ATR은 현재 시장의 변동성을 반영할 수 있다.
가격이 아래에서 위쪽으로 채널을 뚫을 때, 구매 신호가 형성됩니다. 가격이 위에서 아래로 채널을 뚫을 때, 판매 신호가 형성됩니다.
주류 가격 추세 판단과 함께, 단기 주기 돌파구가 장기 주기 추세와 일치하는 방향에서만 진정한 거래 신호가 생성됩니다.
위와 같은 단계를 통해, 이 전략은 가격 변동 동향의 돌파구를 포착할 수 있으며, 주류 동향과 결합하여 잘못된 신호를 피할 수 있다.
우위 분석
이 전략은 다음과 같은 장점을 가지고 있습니다.
이중평등선으로 통로를 형성하여 현재의 가격 변동 범위를 반영한다.
ATR 파라미터를 도입하여 채널 범위를 실시간으로 시장의 변동률을 추적할 수 있게 했다.
주류 가격 추세와 함께 판단하여 불안정한 시장에서 잘못된 신호를 피하십시오.
전략적 판단 규칙은 명확하고 간단하며, 이해하기 쉬운 구현이며, 연구 학습에 적합하다.
위험 분석
이 전략에는 다음과 같은 위험도 있습니다.
돌파 실패 후 착실한 기회는 쉽게 형성된다. 이윤을 얻은 후 포지션을 이동함으로써 이 위험을 줄일 수 있다.
주류 판단에 따라 시간 지연이 존재하고, 잘못된 신호를 완전히 피할 수 없다. 평균선 변수를 적절히 조정하여 줄일 수 있다.
큰 흔들림 시장에서, 중지 손실은 쉽게 뚫릴 수 있습니다. 실시간으로 ATR를 조정하여 시장의 변동에 대응 할 수 있습니다.
최적화 방향
이 전략은 다음과 같은 측면에서 최적화될 수 있습니다.
평균선 계산의 파라미터를 최적화하여 다양한 품종의 최적의 파라미터 조합을 찾을 수 있다.
ATR 파라미터는 또한 채널의 현재 변동성을 더 잘 추적할 수 있도록 최적화 할 수 있습니다.
추가적인 필터 조건, 예를 들어 양력 지표, 변동 지표 등이 추가되어 잘못된 신호를 더욱 방지한다.
기계 학습 기술을 통해 각 매개 변수를 자동으로 최적화하여 매개 변수의 동적 조정을 구현한다.
요약하다
쌍평선 진동 돌파 전략은 쌍평선 통로와 주류 방향 판단을 통해 진동 동향을 포착한다. 이 전략 판단 규칙은 간단하고 명확하며, 이해하기 쉽고 구현할 수 있으며, 돌파 전략을 이해하고 학습하는 훌륭한 사례이다. 이 전략은 계속적으로 최적화된 파라미터 설정과 신호 필터링을 통해 안정성과 수익성을 더욱 향상시킬 수 있다.
/*backtest
start: 2022-11-20 00:00:00
end: 2023-11-26 00:00:00
period: 1d
basePeriod: 1h
exchanges: [{"eid":"Futures_Binance","currency":"BTC_USDT"}]
*/

//Anuj4912
//@version=4
strategy("Anuj4912", overlay=true)
res = input(title="Time Frame",  defval="120")
Factor=input(1, minval=1,maxval = 100)
Pd=input(1, minval=1,maxval = 100)

tp = input(500,title="Take Profit")
sl = input(400,title="Stop Loss")


Up=hl2-(Factor*atr(Pd))
Dn=hl2+(Factor*atr(Pd))
MUp=request.security(syminfo.tickerid,res,hl2-(Factor*atr(Pd)))
MDn=request.security(syminfo.tickerid,res,hl2+(Factor*atr(Pd)))

Mclose=request.security(syminfo.tickerid,res,close)

TrendUp=close[1]>TrendUp[1]? max(Up,TrendUp[1]) : Up
TrendDown=close[1]<TrendDown[1]? min(Dn,TrendDown[1]) : Dn

MTrendUp=Mclose[1]>MTrendUp[1]? max(MUp,MTrendUp[1]) : MUp
MTrendDown=Mclose[1]<MTrendDown[1]? min(MDn,MTrendDown[1]) : MDn

Trend = close > TrendDown[1] ? 1: close< TrendUp[1]? -1: nz(Trend[1],1)
Tsl = Trend==1? TrendUp: TrendDown

MTrend = Mclose > MTrendDown[1] ? 1: Mclose< MTrendUp[1]? -1: nz(MTrend[1],1)
MTsl = MTrend==1? MTrendUp: MTrendDown

linecolor = Trend == 1 ? green : red
plot(Tsl, color = linecolor , style = line , linewidth = 2,title = "SuperTrend")

Mlinecolor = MTrend == 1 ? blue : orange
plot(MTsl, color = Mlinecolor , style = line , linewidth = 2,title = "Main SuperTrend")

plotshape(cross(close,Tsl) and close>Tsl , "Up Arrow", shape.triangleup,location.belowbar,green,0,0)
plotshape(cross(Tsl,close) and close<Tsl , "Down Arrow", shape.triangledown , location.abovebar, red,0,0)

up = Trend == 1 and Trend[1] == -1 and MTrend == 1
down = Trend == -1 and Trend[1] == 1 and MTrend == -1
plotarrow(up ? Trend : na, title="Up Entry Arrow", colorup=lime, maxheight=60, minheight=50, transp=0)
plotarrow(down ? Trend : na, title="Down Entry Arrow", colordown=red, maxheight=60, minheight=50, transp=0)


golong = Trend == 1 and Trend[1] == -1 and MTrend == 1
goshort = Trend == -1 and Trend[1] == 1 and MTrend == -1

strategy.entry("Buy", strategy.long,when=golong)
strategy.exit("Close Buy","Buy",profit=tp,loss=sl)


strategy.entry("Sell", strategy.short,when=goshort)
strategy.exit("Close Sell","Sell",profit=tp,loss=sl)