TSI 및 CCI 기반 Hall 이동 평균 추세 추종 전략


생성 날짜: 2023-11-28 15:53:03 마지막으로 수정됨: 2023-11-28 15:53:03
복사: 0 클릭수: 764
avatar of ChaoZhang ChaoZhang
1
집중하다
1619
수행원

TSI 및 CCI 기반 Hall 이동 평균 추세 추종 전략

개요

이 전략은 상대 강도 지수 (TSI), 상품 경로 지수 (CCI) 및 홀 이동 평균 (Hull MA) 의 세 가지 지표를 결합하여 트렌드 추적 유형의 거래 전략을 형성합니다. 1 시간 또는 더 높은 시간 프레임에 따라 임의의 거래 품종에 대해 긴 줄을 추적 할 수 있습니다.

전략 원칙

이 전략은 주로 TSI와 CCI의 두 지표에 기초하여 시장 추세와 과매매 상황을 판단하고, Hull MA는 가격의 중기 추세를 판단하며, 세 가지가 합동으로 포지션 구축의 기본 조건이다.

구체적으로, TSI의 빠른 라인에서 느린 라인을 통과하고, CCI 지표가 +20&&n1 상승하면, 더 많이; TSI의 빠른 라인 아래에서 느린 라인을 통과하고, CCI 지표가 -20&&n1 하락하면, 공백. 헐 MA는 중기 트렌드를 필터링하기 위해 사용되며, 가격이 헐 MA보다 낮을 때만 더 많이, 가격이 헐 MA보다 높을 때 공백.

따라서, 다른 주기적 지표의 확인을 통해, 가짜 브레이크를 효과적으로 필터링하고, 중장선 트렌드를 추적할 수 있다.

우위 분석

이것은 비교적 안정적이고 효율적인 트렌드 추적 전략으로 다음과 같은 장점이 있습니다.

  1. 장기적 추세 방향을 TSI로 판단하여 단기적 시장 소음으로 인해 방해받지 않도록 하는 것이 더 안정적입니다.

  2. CCI의 추가로, 과매매 현상을 확인하고, 일부 가짜 신호를 필터링할 수 있습니다.

  3. Hull MA의 판단은 입점의 정확성을 높여 수익률을 크게 높였습니다.

  4. 다양한 매개 변수 지표의 통합은 신호의 신뢰도를 높이고, 간섭 확률을 낮출 수 있다.

  5. 전략 파라미터는 다양한 시장 주기에 적응할 수 있는 유연한 최적화 설정을 제공합니다.

위험 분석

이 전략은 안정성이 높지만, 위험도 있습니다.

  1. 이 사건은 급격한 역전으로 이어질 수 있고, 급속히 중단될 수 없고, 큰 손실을 초래할 수 있다.

  2. TSIDiff 및 CCI 지표는 모두 잘못된 신호와 지연이 발생할 수 있으며, 일부 입구 지점을 놓치게 됩니다.

  3. 변수 설정이 잘못되면 거래 빈도가 너무 높거나 신호 품질이 떨어질 수 있습니다.

대책:

  1. 단편적 손실을 통제하기 위한 적절한 정지점 조정;

  2. 신호의 정확도를 향상시키기 위해, 다른 지표와 결합하여, 필요한 경우를 확인합니다.

  3. 시장조정변수에 따라 전략의 안정성을 보장한다.

최적화 방향

이 전략은 다음과 같은 부분에서 최적화될 수 있습니다.

  1. 다른 변수들의 조합을 시도하여 최적의 매칭을 찾습니다.

  2. 기계 학습 알고리즘을 사용하여 변수의 적응적 최적화를 구현합니다.

  3. 수익을 안정화하기 위해 자금 관리 모듈을 추가합니다.

  4. 더 많은 필터와 함께 전략적 승률을 높여줍니다.

이것은 앞으로의 최적화 중점입니다.

요약하다

이 전략은 TSI, CCI 및 Hull MA의 세 가지 지표를 통합하여 안정적이고 효율적인 트렌드 추적 전략을 형성합니다. 여러 시간 단위의 지표의 장점을 성공적으로 적용하여 신호의 품질을 향상시킵니다. 다음 단계는 매개 변수 최적화, 필터 강화 등의 방법으로 전략의 안정성과 수익성을 더욱 강화합니다.
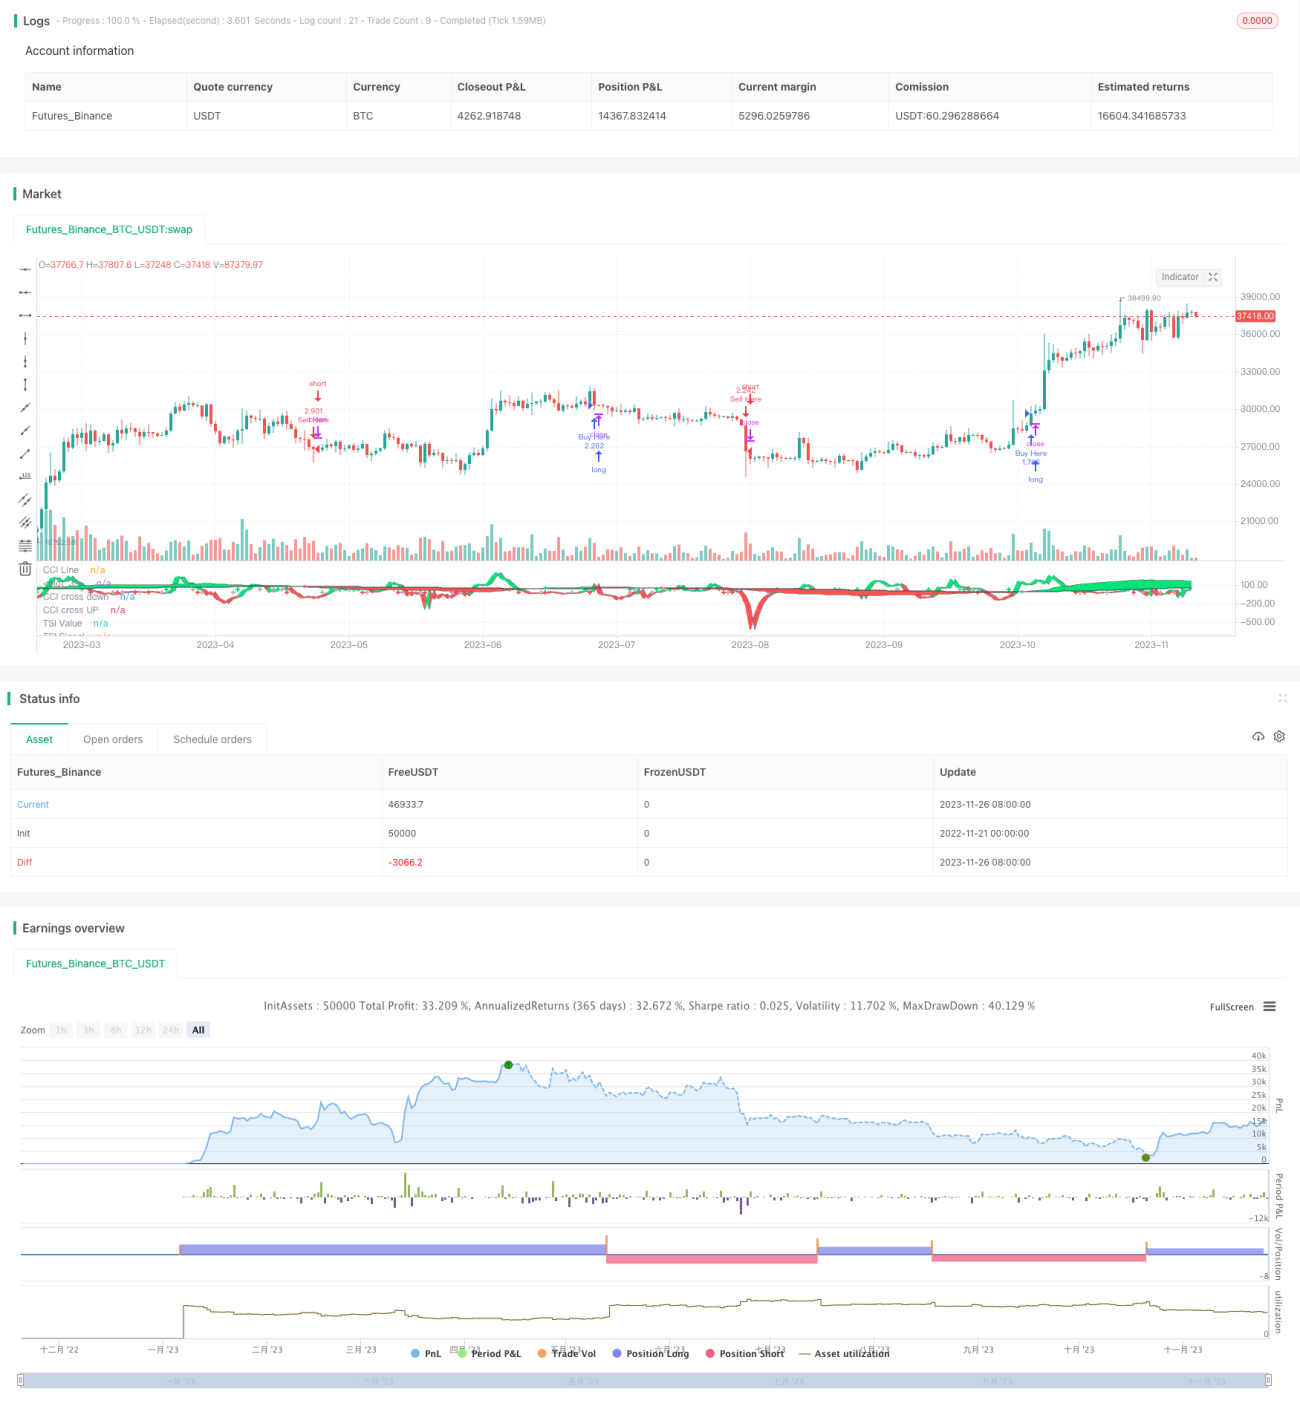
전략 소스 코드
/*backtest
start: 2022-11-21 00:00:00
end: 2023-11-27 00:00:00
period: 1d
basePeriod: 1h
exchanges: [{"eid":"Futures_Binance","currency":"BTC_USDT"}]
*/

//@version=4

strategy(title="TSI CCI Hull", shorttitle="TSICCIHULL", default_qty_type=strategy.percent_of_equity, default_qty_value=100, calc_on_order_fills= false, calc_on_every_tick=true, pyramiding=0)
long = input(title="Long Length", type=input.integer, defval=50)
short = input(title="Short Length", type=input.integer, defval=50)
signal = input(title="Signal Length", type=input.integer, defval=25)
price=input(title="Source",type=input.source,defval=open)
Period=input(25, minval=1)
lineupper = input(title="Upper Line", type=input.integer, defval=100)
linelower = input(title="Lower Line", type=input.integer, defval=-100)
p=price
length= Period
double_smooth(src, long, short) =>
    fist_smooth = ema(src, long)
    ema(fist_smooth, short)
pc = change(price)
double_smoothed_pc = double_smooth(pc, long, short)
double_smoothed_abs_pc = double_smooth(abs(pc), long, short)
tsi_value = 100 * (double_smoothed_pc / double_smoothed_abs_pc)
keh = tsi_value*5 > linelower ? color.red : color.lime
teh = ema(tsi_value*5, signal*5) > lineupper ? color.red : color.lime
meh = ema(tsi_value*5, signal*5) > tsi_value*5 ? color.red : color.lime
i1=plot(tsi_value*5, title="TSI Value", color=color.black, linewidth=1,transp=100)
i2=plot(ema(tsi_value*5, signal*5), title="TSI Signal", color=color.black, linewidth=1,transp=100)
fill(i1,i2,color=meh,transp=85)
plot(cross(tsi_value*5, ema(tsi_value*5, signal*5)) ? tsi_value*5 : na, style=plot.style_circles, color=color.black, linewidth=10)
plot(cross(tsi_value*5, ema(tsi_value*5, signal*5)) ? tsi_value*5 : na, style=plot.style_circles, color=color.white, linewidth=8,transp=0)
plot(cross(tsi_value*5, ema(tsi_value*5, signal*5)) ? tsi_value*5 : na, style=plot.style_circles, color=meh, linewidth=5)
n2ma = 2 * wma(p, round(length / 2))
nma = wma(p, length)
diff = n2ma - nma
sqn = round(sqrt(length))
n1 = wma(diff, sqn)
cci = (p - n1) / (0.015 * dev(p, length))
c = cci > 0 ? color.lime : color.red
c1 = cci > 20 ? color.lime : color.silver
c2 = cci < -20 ? color.red : color.silver
cc=plot(cci, color=c, title="CCI Line", linewidth=2)
cc2=plot(cci[1], color=color.gray, linewidth=1,transp=100)
fill(cc,cc2,color=c,transp=85)
plot(cross(20, cci) ? 20 : na, style=plot.style_cross,title="CCI cross UP",  color=c1, linewidth=2,transp=100,offset=-2)
plot(cross(-20, cci) ? -20 : na, style=plot.style_cross,title="CCI cross down",  color=c2, linewidth=2,transp=100,offset=-2)

TSI1=ema(tsi_value*5, signal*5)
TSI2=ema(tsi_value*5, signal*5)[2]

hullma_smoothed = wma(2*wma(n1, Period/2)-wma(n1, Period), round(sqrt(Period)))
//plot(hullma_smoothed*200)

longCondition = TSI1>TSI2 and hullma_smoothed<price and cci>0
if (longCondition and cci>cci[1] and cci > 0 and n1>n1[1])
    strategy.entry("Buy Here", strategy.long)

shortCondition = TSI1<TSI2 and hullma_smoothed>price and cci<0
if (shortCondition and cci<cci[1] and cci < 0 and n1<n1[1])
    strategy.entry("Sell Here", strategy.short)