
이 전략은 서로 다른 시간 프레임의 양적 지표를 결합하여 비트코인 가격 범위를 식별하여 거래를 추적합니다. 이 전략은 5 분 시간 프레임으로 장기간에 걸쳐 범위를 보유하여 이익을 얻습니다.
이 전략은 다중 시간 프레임 결합과 진영 추적 방식을 통해 비트코인에 대한 중장선 트렌드를 효과적으로 포착합니다. 짧은 라인 거래에 비해 중장선 진영 거래의 회전이 작고, 수익의 여지가 더 큽니다. 다음으로, 매개 변수 조정 및 위험 관리 전략의 추가로 전략의 수익률과 안정성을 더욱 향상시킬 수 있습니다.
/*backtest
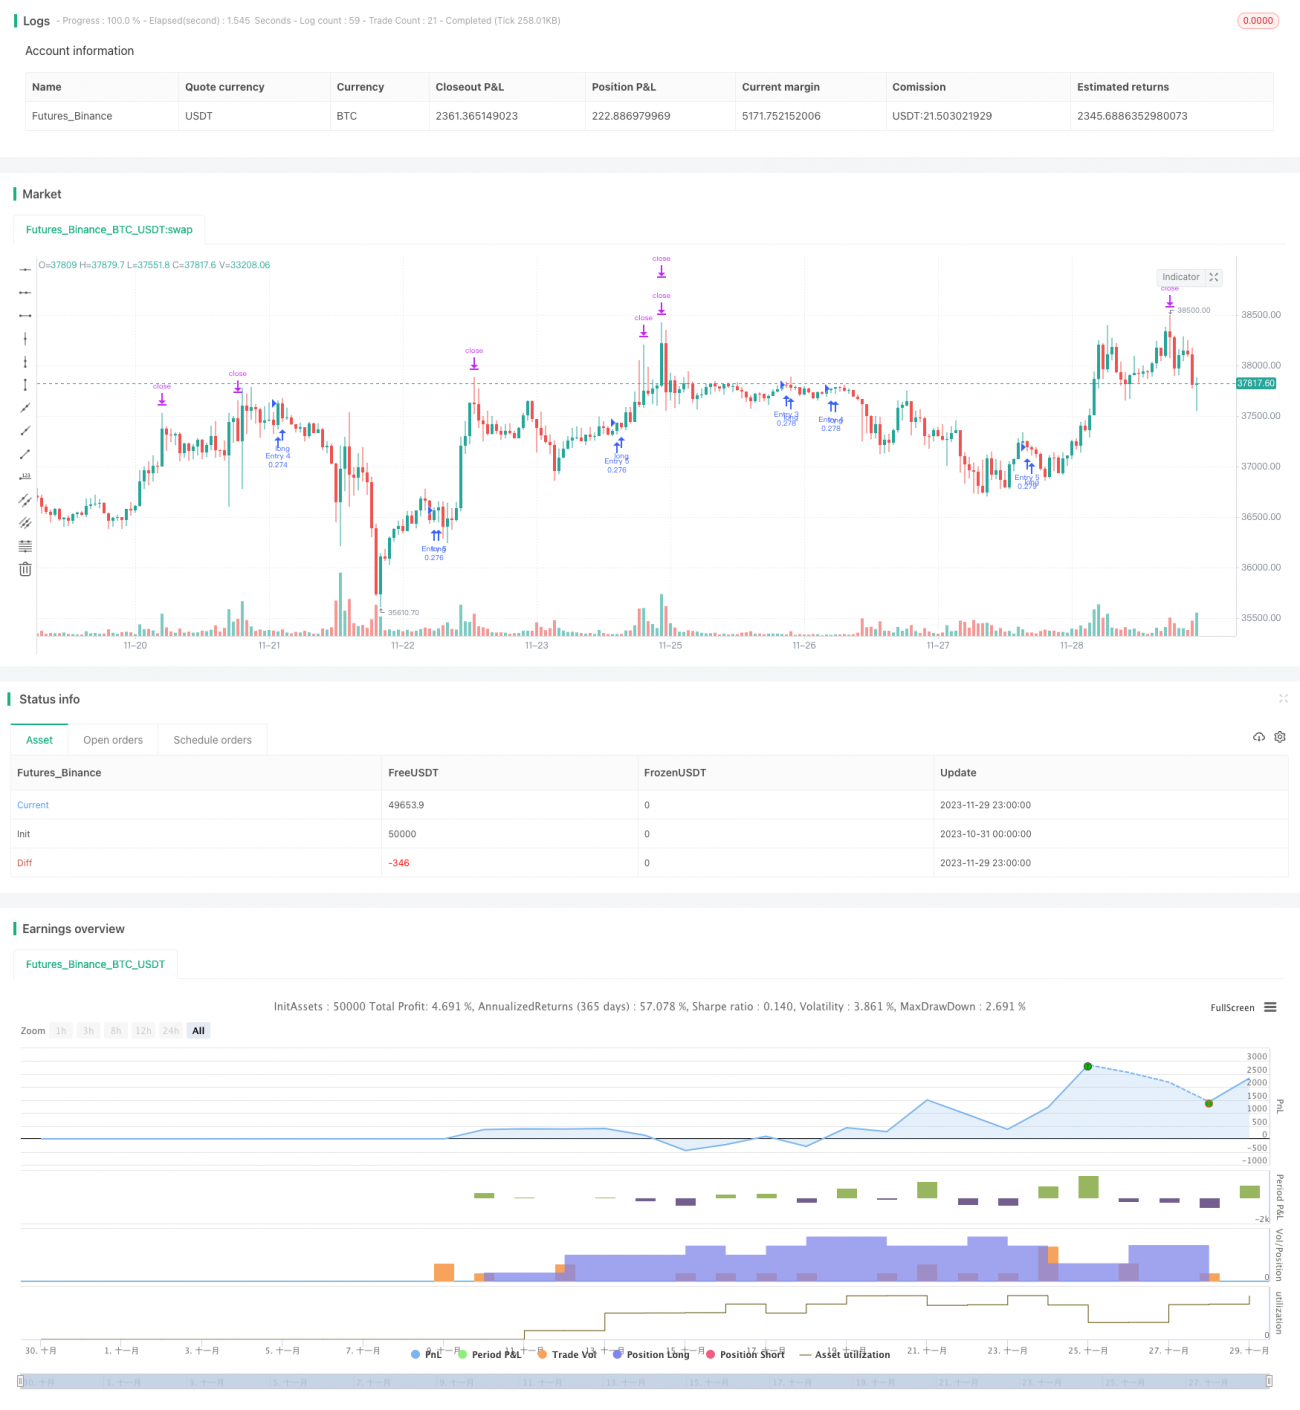
start: 2023-10-31 00:00:00
end: 2023-11-30 00:00:00
period: 1h
basePeriod: 15m
exchanges: [{"eid":"Futures_Binance","currency":"BTC_USDT"}]
*/
//@version=4
strategy(title='Pyramiding BTC 5 min', overlay=true, pyramiding=5, initial_capital=10000, default_qty_type=strategy.percent_of_equity, default_qty_value=20, commission_type=strategy.commission.percent, commission_value=0.075)
//the pyramide based on this script https://www.tradingview.com/script/7NNJ0sXB-Pyramiding-Entries-On-Early-Trends-by-Coinrule/
//
fastLength = input(250, title="Fast filter length ", minval=1)
slowLength = input(500,title="Slow filter length", minval=1)
source=close
v1=ema(source,fastLength)
v2=ema(source,slowLength)
//
//Backtest dates
fromMonth = input(defval=1, title="From Month")
fromDay = input(defval=10, title="From Day")
fromYear = input(defval=2020, title="From Year")
thruMonth = input(defval=1, title="Thru Month")
thruDay = input(defval=1, title="Thru Day")
thruYear = input(defval=2112, title="Thru Year")
showDate = input(defval=true, title="Show Date Range")
start = timestamp(fromYear, fromMonth, fromDay, 00, 00) // backtest start window
finish = timestamp(thruYear, thruMonth, thruDay, 23, 59) // backtest finish window
window() => // create function "within window of time"
time >= start and time <= finish ? true : false
leng=1
p1=close[1]
len55 = 10
//taken from https://www.tradingview.com/script/Ql1FjjfX-security-free-MTF-example-JD/
HTF = input("1D", type=input.resolution)
ti = change( time(HTF) ) != 0
T_c = fixnan( ti ? close : na )
vrsi = rsi(cum(change(T_c) * volume), leng)
pp=wma(vrsi,len55)
d=(vrsi[1]-pp[1])
len100 = 10
x=ema(d,len100)
//
zx=x/-1
col=zx > 0? color.lime : color.orange
//
tf10 = input("1", title = "Timeframe", type = input.resolution, options = ["1", "5", "15", "30", "60","120", "240","360","720", "D", "W"])
length = input(50, title = "Period", type = input.integer)
shift = input(1, title = "Shift", type = input.integer)
hma(_src, _length)=>
wma((2 * wma(_src, _length / 2)) - wma(_src, _length), round(sqrt(_length)))
hma3(_src, _length)=>
p = length/2
wma(wma(close,p/3)*3 - wma(close,p/2) - wma(close,p),p)
b =security(syminfo.tickerid, tf10, hma3(close[1], length)[shift])
//plot(a,color=color.gray)
//plot(b,color=color.yellow)
close_price = close[0]
len = input(25)
linear_reg = linreg(close_price, len, 0)
filter=input(true)
buy=crossover(linear_reg, b)
longsignal = (v1 > v2 or filter == false ) and buy and window()
//set take profit
ProfitTarget_Percent = input(3)
Profit_Ticks = close * (ProfitTarget_Percent / 100) / syminfo.mintick
//set take profit
LossTarget_Percent = input(10)
Loss_Ticks = close * (LossTarget_Percent / 100) / syminfo.mintick
//Order Placing
strategy.entry("Entry 1", strategy.long, when=strategy.opentrades == 0 and longsignal)
strategy.entry("Entry 2", strategy.long, when=strategy.opentrades == 1 and longsignal)
strategy.entry("Entry 3", strategy.long, when=strategy.opentrades == 2 and longsignal)
strategy.entry("Entry 4", strategy.long, when=strategy.opentrades == 3 and longsignal)
strategy.entry("Entry 5", strategy.long, when=strategy.opentrades == 4 and longsignal)
if strategy.position_size > 0
strategy.exit(id="Exit 1", from_entry="Entry 1", profit=Profit_Ticks, loss=Loss_Ticks)
strategy.exit(id="Exit 2", from_entry="Entry 2", profit=Profit_Ticks, loss=Loss_Ticks)
strategy.exit(id="Exit 3", from_entry="Entry 3", profit=Profit_Ticks, loss=Loss_Ticks)
strategy.exit(id="Exit 4", from_entry="Entry 4", profit=Profit_Ticks, loss=Loss_Ticks)
strategy.exit(id="Exit 5", from_entry="Entry 5", profit=Profit_Ticks, loss=Loss_Ticks)