듀얼 지표 조합을 통한 미친 당일 스캘핑 전략

개요
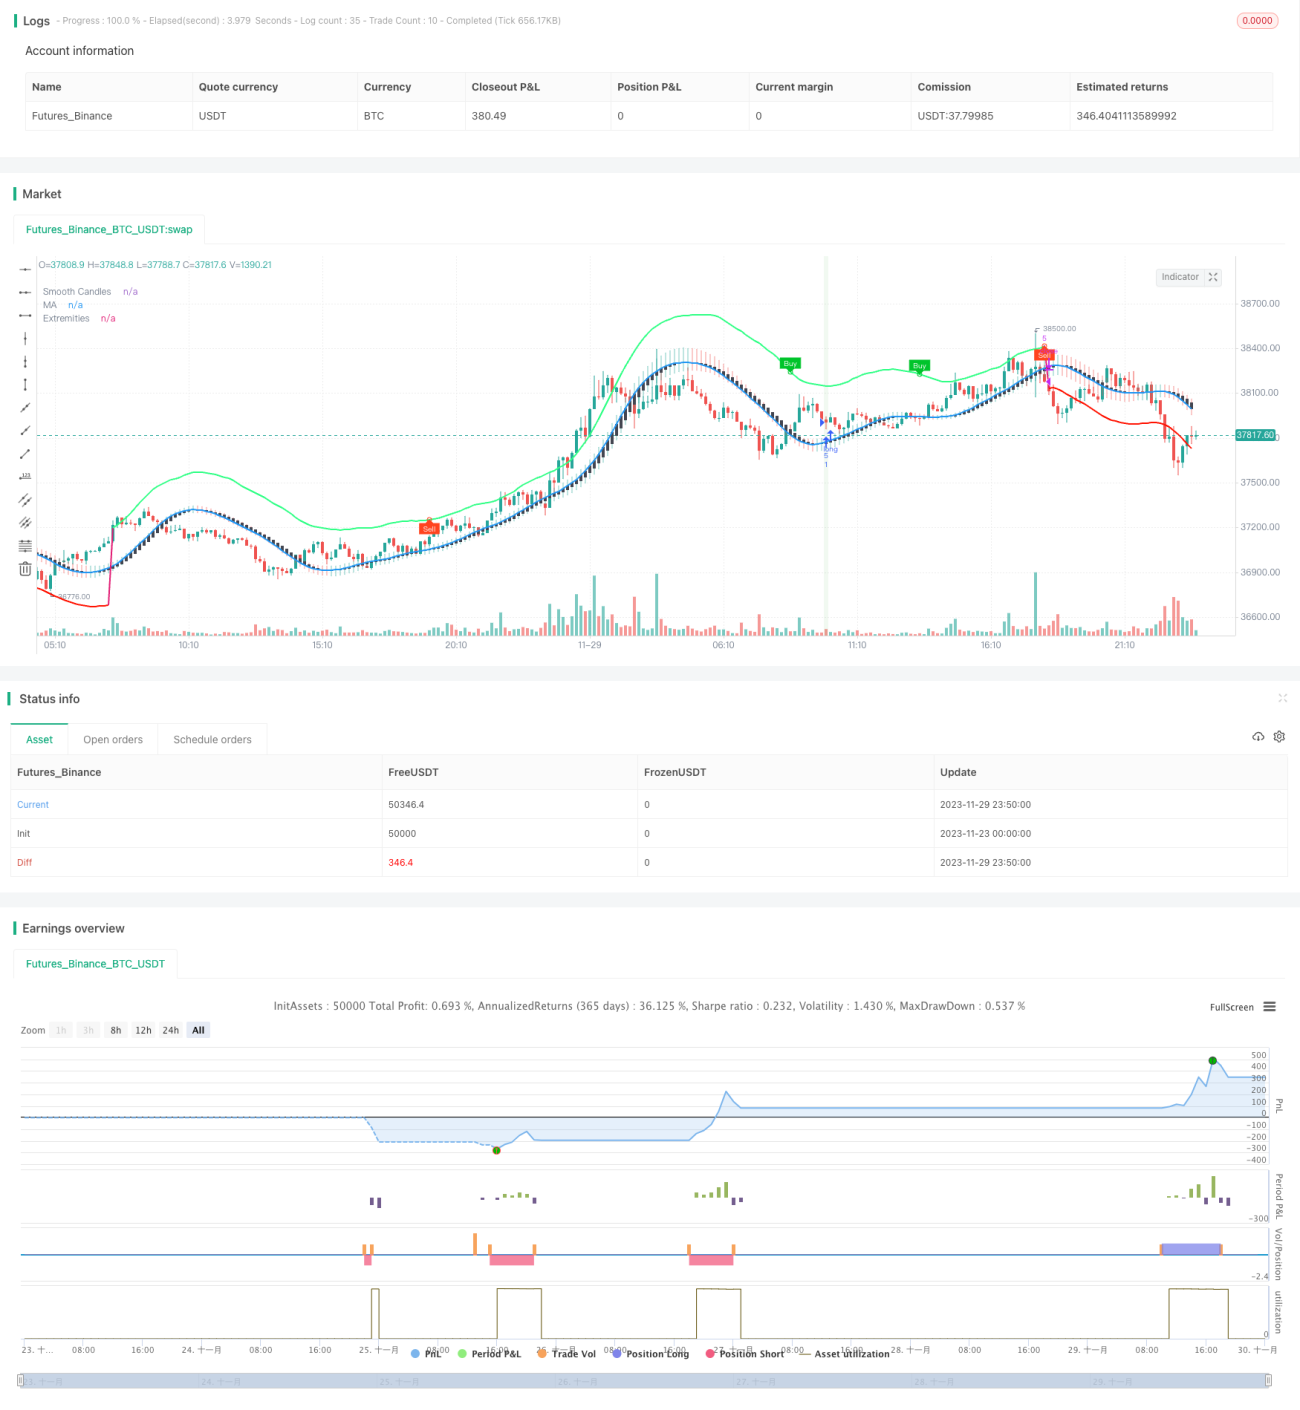
이 전략은 LuxAlgo가 개발한 TMO와 AMA 두 지표의 매매 신호를 조합하여, 충격적인 정리에서 트렌드가 시작되는 기회를 잡는다. TMO 지표의 매매 신호, AMA 지표의 매매 극치, K선 실물량이 점차 확대되는 등의 여러 조건을 충족한 후, 추가적으로 공백을 한다.
전략 원칙
TMO 지표는 가격 움직임을 반영한다. 그것은 충격 지표 유형에 속하며, 가격이 이탈 할 때 거래 신호를 발산 할 수 있다. AMA 지표는 평평한 이동 평균 지표이다. 그것은 가격 변동의 한 범위를 표시하며, 가격이 위아래로 접근 할 때 과매 현상을 나타냅니다.
이 전략의 주요 논리는: TMO 지표는 가격 추세에서 벗어난 거래 신호를 제공하며, AMA 지표는 가격이 반전 될 수있는 지역을 표시하며, K 선의 개체 수를 확대하여 트렌드 시작을 확인합니다. 따라서 이들의 조합은 거래 성공률을 높일 수 있습니다. 구체적으로, 전략은 다음과 같은 경우에 상장 또는 상장을합니다.
- TMO 지표가 나타난 다중 신호, 즉 가격이 상향에서 벗어난 AND AMA 지표가 나타난 다중 극대 값
- TMO 지표에 코스피 신호가 나타납니다. 즉, 가격이 하향으로 돌아갑니다. AND AMA 지표에 코스피 최소값이 나타납니다.
- 또한 최근 3개의 K선들의 개체수가 점점 더 커지고 있다.
이렇게 함으로써 단일 지표로 인해 발생하는 잘못된 신호 문제를 해결한다. 스피드 방식은 가장 최근의 N 근 K 라인 내에서 가장 높은 가격과 가장 낮은 가격을 선택하여 위험을 더 잘 제어 할 수 있다.
전략적 이점
이 전략에는 다음과 같은 장점이 있습니다.
-
지표 조합, 신호 정확도를 높인다. TMO 지표와 AMA 지표는 서로 검증하여 가짜 신호를 줄여서 신호 정확도를 높인다.
-
여러 조건의 조합, 캡처 트렌드 시작. 전략에 의해 설정된 TMO 지표 신호, AMA 지표 극치값 및 K선 개체량 확대 등 여러 조건, 트렌드 시작 시점을 효과적으로 캡처 할 수 있습니다. 이것은 Scalping 전략의 추구 목표입니다.
-
K선 손해방식 위험 제어. K선 최근 최고 가격 최저 가격을 사용해서 손해방식으로, 각 상품의 위험을 비교적 잘 제어할 수 있다. 또한 지표 재계산으로 인해 발생하는 지연 위험을 반전시키지 않는다.
-
간결하고 효과적인 거래 논리. 이 전략은 단지 두 개의 지표를 사용하여 비교적 완전한 스칼핑 전략을 구현합니다. 복잡하지 않으며 논리는 간결하고 명확합니다. 그리고 예제 결과에 따르면 전략은 좋은 수익을 창출합니다.
전략적 위험
이 전략에는 다음과 같은 위험들이 있습니다.
-
자주 출장 위험. 스칼핑 전략으로, 그 보유 기간은 오래되지 않으며, 거래 비용이 높으면 수익에 영향을 미칠 수 있다.
-
K선 상쇄는 너무 급진적인 위험이다. 최근 최고 가격과 최저 가격을 상쇄로 사용하는 것은 상쇄가 급진적이기 때문에 시장의 소음을 완전히 필터링 할 수 없으며 상쇄가 유발 될 확률을 증가시킵니다.
-
매개 변수 최적화 난이도 위험. 전략은 여러 개의 매개 변수를 포함하고, 최적의 매개 변수 조합을 찾는 것은 비교적 어려울 수 있다.
최적화 방향
이 전략은 다음과 같은 방향으로 최적화될 수 있습니다.
-
시장 거래량과 같은 더 많은 필터링 지표를 추가하면 가짜 신호를 필터링 할 수 있으며 신호 품질을 더욱 향상시킬 수 있습니다.
-
스톱 모드에서 필터링 조건을 추가하여 스톱이 너무 급진적이지 않도록하십시오. 예를 들어, 스톱을 터치하기 전에 몇 개의 K 라인 확인을 기다렸다가 스톱을 중지하십시오.
-
파라미터를 최적화하여 지표 파라미터의 최적의 조합을 찾습니다. 이것은 더 많은 잡음을 필터링하여 전략 승률을 높일 수 있습니다. 주요한 최적화는 TMO 지표 길이, AMA 지표 길이 및 배수와 같은 파라미터입니다.
-
다양한 품종과 시기를 통해 재검토와 실판을 시도하여 전략의 논리에 가장 적합한 거래 품종과 시기를 찾으십시오.
요약하다
이 전략은 TMO 지표와 AMA 지표의 거래 신호를 조합하여, 불안정한 상황에서 트렌드가 시작되는 시점을 찾기 위해 스칼핑 조작을 한다. 그것은 신호 정확도가 높고, 트렌드를 일찍 포착하고 위험을 제어하는 장점이 있다. 추가적인 매개 변수 및 규칙 최적화를 한 후, 이 전략은 매우 강력한 실전용 가치가있는 일일 스칼핑 전략이 될 수 있다.
- 1