트리플 슈퍼 트렌드 양적 거래 전략

1
Follow
1779
Followers
개요
트리플 오버트렌드 양적 거래 전략은 트리플 오버트렌드 지표를 결합한 단선 거래 전략이다. 이 전략은 암호화폐, 외환 등과 같은 고주파 거래 시장의 일일 거래와 단선 중매에 적합하다.
전략 원칙
- 200일 이동 평균을 사용하여 전체 시장 추세 방향을 판단하십시오. 가격이 올라갈 때 더하고, 가격이 내려갈 때 더 <unk>니다.
- 삼중 초향 지표를 사용하여 세그먼트 시장의 경향 방향을 판단한다. 초향 지표는 세그먼트 시장의 다공간 경향을 정확하게 판단할 수 있다.
- 브린 띠를 사용하여 과매매 과매매를 판단하는 스토흐 RSI 지표가 입시 신호를 구축한다. 스토흐 RSI는 역전 기회를 식별할 수 있다.
- 오버 트렌드 스톱에 따라 오버 트렌드 스톱은 리스크 수익률의 1.5배를 결정한다.
전략적 이점
- 다중 트렌드 지표 검증, 의사 결정의 정확성 향상
- 오버 바이 오버 셀 지표는 역전 기회를 인식하고 역전 시동을 잡습니다.
- 손해 막기 메커니즘 제어 위험과 이익 비율.
- 고주파 단선 거래에 적합하며, 수익의 여지가 크다.
전략적 위험
- 대주기상황이 좋지 않을 때, 단선거래는 손실 위험이 크다.
- 하지만, 이 모든 것은 잘못된 결정을 내리는 역기능의 실패의 가능성이 여전히 존재한다는 것을 의미합니다.
- <unk>거래가 자주 필요하고, 외래 거래에는 적합하지 않다.
전략 최적화
- 이동 평균 파라미터를 최적화하여 더 긴 주기에 적응한다.
- Stoch RSI 파라미터를 최적화하여 잘못된 신호율을 낮춘다.
- 오버 트렌드 ATR 사이클 파라미터를 최적화하여 스톱로스 효과를 높인다.
- 포지션 관리를 늘리고, 철수량에 따라 포지션을 늘린다.
요약하다
삼중 초 트렌드 수량 거래 전략, 다중 트렌드 지표 검증을 사용하여 의사 결정 정확도를 높이고, 손실 중지 스<unk> 위험 수익률을 제어합니다. 고 주파수 단선 거래에 적합합니다. 최적화 매개 변수는 더 긴 거래 주기에 적응할 수 있으며, 잘못된 신호 발송 가능성을 줄이고, 손실 중지 스<unk> 효과를 향상시킵니다. 포지션 관리를 추가하면 시세 조정 시 포지션을 추가하여 수익 공간을 확장 할 수 있습니다.
Source
Pine
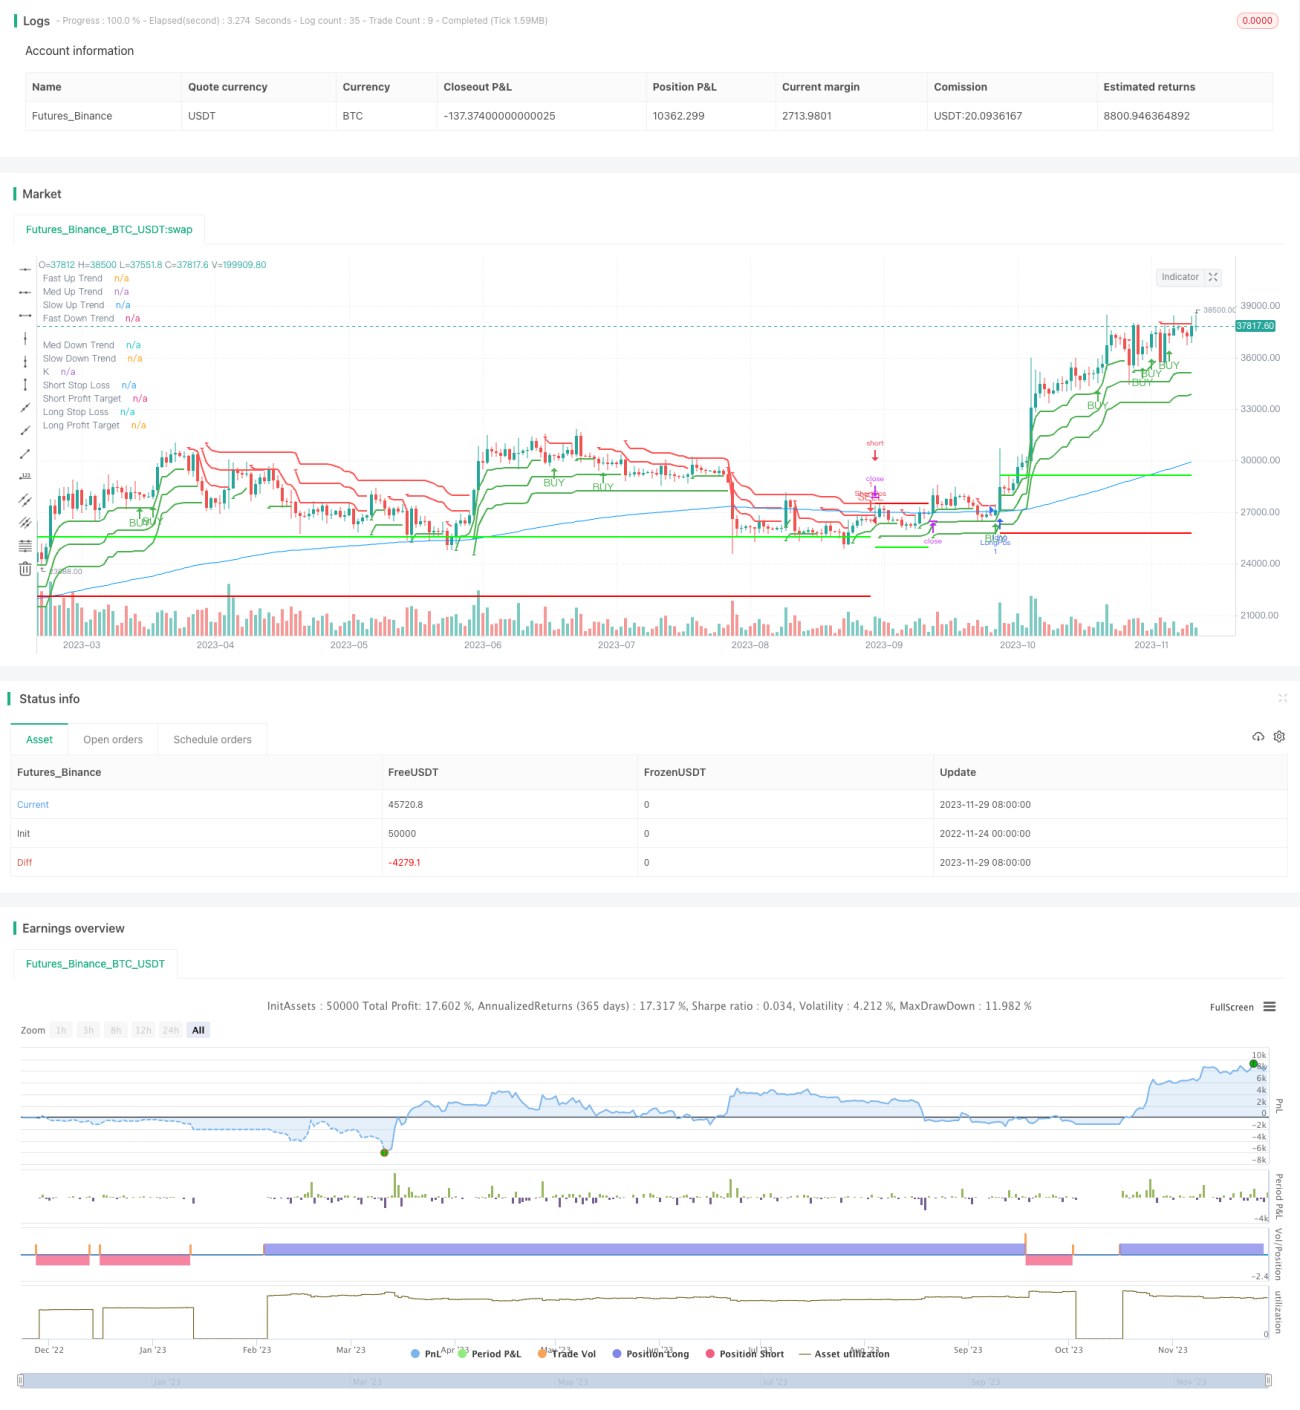
/*backtest
start: 2022-11-24 00:00:00
end: 2023-11-30 00:00:00
period: 1d
basePeriod: 1h
exchanges: [{"eid":"Futures_Binance","currency":"BTC_USDT"}]
*/

//@version=4
strategy("3x SuperTrend Strategy (Mel0nTek) V1", calc_on_every_tick=true, overlay=true)

// ***************************************************Strategy parameters
Related strategies
Comment
All comments (0)
No data
- 1