채널 및 선형 회귀를 기반으로 한 Hull MA 오실레이터 전략

1
Follow
1778
Followers
개요
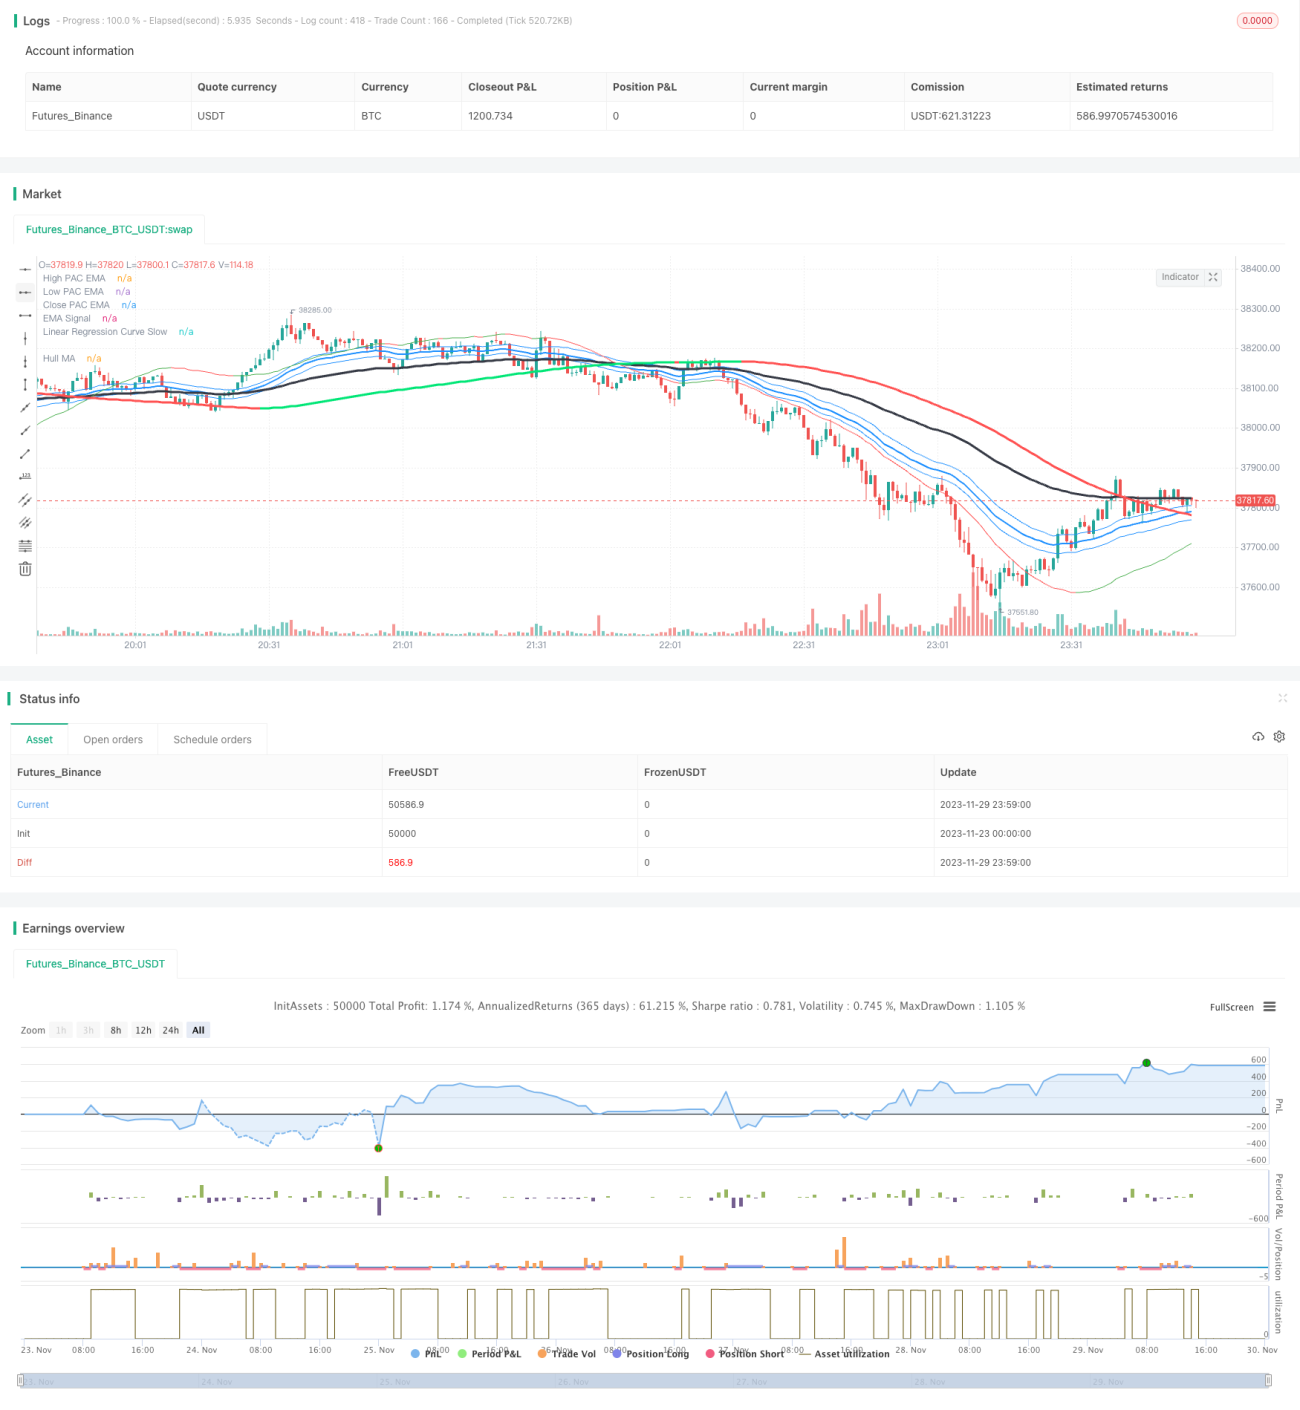
이 전략은 Hull MA, 가격 채널, EMA 신호 및 선형 회귀를 결합한 변동 거래 전략이다. 이 전략은 Hull MA를 사용하여 시장 추세 방향을 판단하고, 가격 채널 및 선형 회귀를 판단 하위 지역을 판단하고, EMA 신호를 판단 시장에 들어가는 시점을 판단하여 중단선 추세를 포착한다.
전략 원칙
이 전략은 주로 다음과 같은 몇 가지 지표로 구성됩니다.
- Hull MA
- Hull MA의 일반 변수는 337이며, 중장선 경향 방향을 나타냅니다.
- 2배 18주기 WMA가 337주기 WMA보다 높을 때 다단 시장, 반대로 공단 시장
- 가격 채널
- 가격 채널은 높은 낮은 가격의 EMA로 구성되어 있으며, 지지 및 저항이 형성될 수 있는 지역을 나타냅니다.
- EMA 신호
- EMA 신호 기간은 일반적으로 89 주기로, 단선 트렌드 및 상장 신호를 나타냅니다.
- 선형 회귀
- 빠른 라인 6 주기, 바닥과 돌파구를 판단
- 느린 선89주기, 중장선 트렌드 방향 판단
입력 논리:
다중 입구: Hull MA 상향과 상반된 가격, 짧은 EMA를 가로질러 상향으로 선형 회귀
허드 엔트리: Hull MA 하향으로 하향 레일보다 저렴하며, 선형 회귀 하향으로 단기 EMA를 통과
출전 논리:
다중 출전: 하차선보다 낮은 가격으로 선형 회귀를 거쳐 하차
空頭出場: 상반도의 가격과 상향의 선형 회귀를 통과한다
우위 분석
이 전략은 다음과 같은 장점을 가지고 있습니다.
- 다중 지표 포지션은 더 정확합니다.
- 헐 MA 판단 주 트렌드, 채널 판단 지지 압력, EMA 판단 진입 시점
- '조금'의 '조금'은 '조금'의 '조금'을 '조금'으로 표현한다.
- 전략은 역으로 주축이 되는 스윙 트레이딩 전략으로, 각 중단계 사이클의 트렌드를 포착할 수 있다.
- 리스크가 통제 가능하고 회수량이 적습니다.
- 전략은 높은 확률 영역에서만 신호를 발송하고, 높은 가격과 낮은 가격의 추격을 피한다.
위험 분석
이 전략에는 위험도 있습니다.
- 매개 변수 최적화 공간 제한
- 주요 변수로는 EMA 주기가 고정되어 있고, 최적화 공간이 작다.
- 지진으로 인한 손실 가능성
- 가격의 수평적 변동이 있을 때, 손해배상 제동이 발생할 수 있습니다.
- 기술 분석 기반이 필요합니다.
- 전략적 사고는 가격 행동과 지표에 대한 지식을 필요로하며 모든 사람에게 적합하지 않습니다.
다음의 몇 가지 측면에서 최적화할 수 있습니다.
- 지진 후 피해를 줄이는 것과 같은 손해 방지 전략을 조정하는 것
- 경기 출전 논리를 최적화
- MACD와 같은 다른 지표 필터를 추가합니다.
요약하다
이 전략은 Hull MA, 가격 채널, EMA 및 선형 회귀와 같은 여러 지표를 통합하여 보다 완전한 중단계 휘저기 거래 전략을 형성한다. 단일 지표에 비해 이 전략은 판단 정확도를 크게 향상시킬 수 있으며, 추세와 반동에서 이익을 잡을 수 있다. 그러나 기술 분석 기반이 필요한 특정 위험이 있습니다.
Source
Pine
Strategy parameters
Related strategies
Comment
All comments (0)
No data
- 1