TFO 및 ATR 기반 추세 추종 손절매 전략

개요
이 전략은 Dr. John Ehlers의 트렌드 플렉스 오스실레이터 (Trend Flex Oscillator, TFO) 와 평균 실제 진동 범위 (Average True Range, ATR) 지표에 기반한 트렌드 추적 손실 전략이다. 이 전략은 오버솔드 이후의 가격이 반전될 때 오버솔드 포지션을 열기 위해 적용된다.
전략 원칙
이 전략은 TFO와 ATR 두 가지 지표를 결합하여, 구매 조건이 충족되면 상장을 열고, 판매 조건이 충족되면 매각한다.
구매 조건: TFO가 어떤 임계 값보다 낮을 때, 그리고 상위 K 선의 TFO 값이 현재 K 선보다 낮을 때, 그리고 ATR이 설정된 변동 문턱보다 높을 때, 이 세 가지 조건을 충족하면 더 많은 포지션을 열 수 있다.
평정상황: TFO가 어떤 경계를 초과할 때, 그리고 ATR이 설정된 문턱을 초과할 때, 조건이 충족되면, 모든 상장을 평정한다. 또한, 이 전략은 추적 손실을 설정하고, 가격이 설정된 추적 중지 손실 가격을 넘어서는 경우, 모든 상장을 평정한다. 사용자는 지표 신호에 따라 전략을 평정하도록 선택할 수 있습니다. 또는 손실 평정 가격에 따라만 평정한다.
이 전략은 최대 15개의 여러 상점 포지션을 동시에 열 수 있다. 이 전략의 매개 변수는 조정할 수 있으며, 다른 시간 주기에도 적용된다.
전략적 이점
-
트렌드와 변동성을 결합하여 시장 방향을 판단하고, 비교적 안정적이다. TFO는 트렌드 돌파의 초기 신호를 포착할 수 있고, ATR은 시장 변동이 증가하는 시점을 파악할 수 있다.
-
조정할 수 있는 매매 변수와 스톱로스 변수를 설정하여 조작이 유연하다. 사용자는 시장에 따라 변수를 조정하여 최적화를 달성할 수 있다.
-
내장된 Stop Loss 기능으로 극한상황의 손실을 줄일 수 있다. Stop Loss 전략은 양적 거래의 매우 중요한 부분이다.
-
추가 상장 및 일부 평상시 지원, 포지션을 확대하여 수익을 증대할 수 있다.
전략적 위험
-
이 전략은 더 많이 하고, 공백을 두지 않고, 하락시장에서 이익을 얻을 수 없습니다. 끔찍한 곰 시장 상황이 발생하면 엄청난 손실이 발생할 수 있습니다.
-
잘못된 매개 변수 설정은 과도한 거래 또는 매매를 유도할 수 있다. 최적의 매개 변수 조합을 찾기 위해 반복 테스트가 필요하다.
-
극단적인 상황에서는 막힘이 무효가 되어 큰 손실을 막을 수 없다. 이것은 모든 막힘 전략이 직면할 수 있는 문제이다.
-
재검토는 실제 거래 상황을 완전히 반영하지 않으며, 실제 거래 결과에 따라 약간의 편차가있을 수 있습니다.
전략 최적화
-
판매 조건에 모바일 스톱 라인을 추가하는 것을 고려할 수 있습니다. 전략이 적시에 스톱을 하고, 하향 위험을 효과적으로 제어할 수 있도록 합니다.
-
공백 메커니즘을 확장할 수 있으며, TFO 반전 하락과 ATR이 충분히 커지면 공백 포지션을 열 수 있어 전략이 공백 시장에 적용될 수 있다.
-
거래량 변화와 같은 더 많은 필터링 조건을 추가하여 비정상적인 행위가 전략에 미치는 영향을 줄일 수 있습니다.
-
다른 시간 주기들의 파라미터 설정과 재검토 결과를 테스트하여 최적의 주기 및 파라미터 조합을 찾을 수 있다.
요약하다
이 전략은 트렌드 분석과 변동성 모니터링의 장점을 통합하여 TFO와 ATR의 지표 조합을 통해 시장 방향을 판단합니다. 추가 입장을 개설하고, 일부 입장을 평형하고, 위험을 제어 할 수있는 이동 중지 등의 메커니즘을 설정하여 다자 행정에 적합합니다. 더 많은 지표 필터링과 파라미터 조정 기능을 추가하여 전략 성능을 더욱 향상시킬 수있는 확장 가능한 최적화 공간이 있습니다.
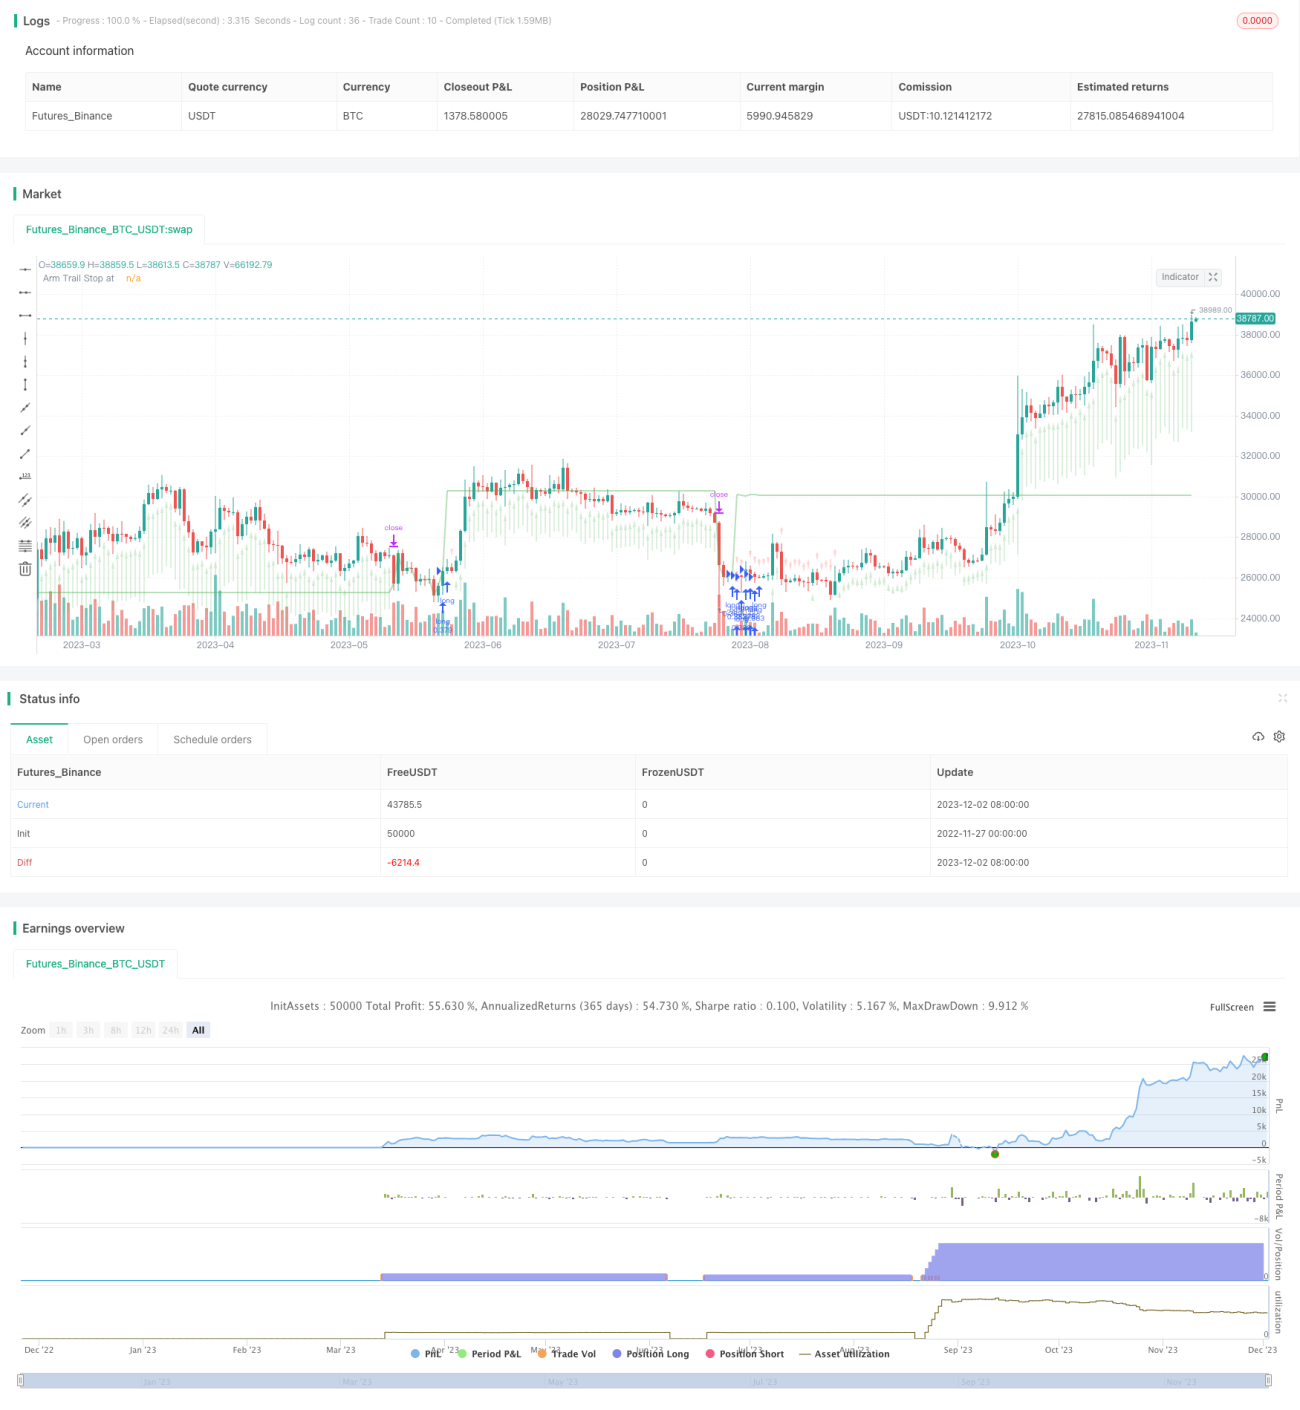
/*backtest
start: 2022-11-27 00:00:00
end: 2023-12-03 00:00:00
period: 1d
basePeriod: 1h
exchanges: [{"eid":"Futures_Binance","currency":"BTC_USDT"}]
*/

// This source code is subject to the terms of the Mozilla Public License 2.0 at https://mozilla.org/MPL/2.0/
// © Chart0bserver
//
// Open Source attributions:- 1