더블 이동 평균 교차 추세 전략


생성 날짜: 2023-12-06 11:52:10 마지막으로 수정됨: 2023-12-06 11:52:20
복사: 0 클릭수: 741
avatar of ChaoZhang ChaoZhang
1
집중하다
1619
수행원

더블 이동 평균 교차 추세 전략

개요

쌍평선 교차 트렌드 전략은 이동 평균을 기반으로 한 거래 전략이다. 그것은 빠른 EMA와 느린 SMA의 교차를 구매 및 판매 신호로 사용하고 MACD 지표의 오차와 결합하여 필터링 신호를 제공합니다. 이 전략은 가격, 경향 및 동력과 같은 여러 요소를 동시에 고려하여 비교적 완전한 거래 시스템을 형성합니다.

전략 원칙

이 전략은 EMA와 SMA의 두 가지 이동 평균을 사용합니다. 이 중 EMA의 길이는 200일, SMA의 길이는 100일입니다. 가격이 상승하면 두 개의 평균선을 돌파하면 구매 신호가 발생하고, 가격이 하락하면 두 개의 평균선을 돌파하면 판매 신호가 발생합니다.

신호의 신뢰성을 더욱 높이기 위해, 전략은 MACD 지표를 도입했다. 가격이 EMA와 SMA를 뚫고 신호를 형성할 때, MACD의 빠른 선이 아래에서 느린 선을 뚫고, MACD 기둥이 0축 위에 있을 때 진정한 구매 신호를 유발할 필요가 있다. 반대로, MACD의 빠른 선이 위에서 느린 선을 뚫고, MACD 기둥이 0축 아래에 있을 때 진정한 판매 신호를 유발할 수 있다.

또한, 전략은 스톱로스 및 스톱을 설정한다. 전략이 포지션을 개설한 후, 사용자 설정에 따라 비율을 계산하고 스톱로스 및 스톱을 설정한다. 따라서 단일 거래의 위험을 효과적으로 제어 할 수 있다.

전체적으로, 이 전략은 여러 지표를 고려하고, 구매 및 판매 신호에 대해 엄격한 필터링 조건을 설정하고, 스톱 스톱 리스크 관리를 적용하여, 비교적 엄격하고 완전한 거래 시스템을 형성한다.

우위 분석

이중 평행선 교차 트렌드 전략에는 다음과 같은 장점이 있습니다.

  1. 여러 지표와 함께 가격, 추세, 동력을 종합적으로 고려하여 신호에 엄격한 필터링 조건을 설정하여 가짜 신호를 효과적으로 방지하고 신호의 신뢰성을 향상시킬 수 있습니다.

  2. 두 개의 다른 파라미터의 이동 평균을 사용하여 시장 추세를 더 잘 식별하고, 변동 상황을 필터링 할 수 있습니다. 빠른 EMA 라인은 가격 변화를 시간적으로 추적하는 데 사용됩니다. 느린 SMA 라인은 장기적인 추세를 판단하는 데 사용됩니다. 두 개의 평형 라인을 조합하여 사용하는 것이 더 효과적입니다.

  3. MACD 지표에는 다양한 매개 변수를 도입하여 다양한 시장의 특성에 따라 조정할 수 있으며 유연성이 높습니다. MACD의 설정은 거래 신호가 가격, 경향 및 동력의 지원을 동시에받을 수 있도록 보장하여 강력한 응용 가치를 갖습니다.

  4. 단편 거래 손실을 최대한 제어하기 위해 스톱 손실 지점을 설정하여 SIZE_MATHFUNC 단편적 손실의 과도한 위험. 합리적인 비율의 정지 설정은 수익의 일부를 잠금하고, 수익 이후의 시장 위험 노출을 줄일 수 있다.

  5. 이 전략의 매개 변수는 유연하게 설정할 수 있으며, 최적화 결과에 따라 전략에 대한 조정이 가능하며, 실용성이 매우 강하다. 다양한 시장과 매개 변수를 테스트하는 최적화 공간은 넓다.

위험 분석

이중 평행선 교차 트렌드 전략에는 다음과 같은 몇 가지 측면에 초점을 맞추는 몇 가지 위험도 있습니다.

  1. 주가가 급격한 변동을 나타낼 때, EMA와 SMA가 여러 번 오차로 교차하여 거래 신호의 빈번한 열과 닫기를 초래할 수 있습니다. 이것은 거래 빈도와 수수료 지출을 증가시킬 것입니다.

  2. MACD 지표가 가짜 돌파구가 발생할 수 있는 상황, 특히 흔들림의 속도가 아직 명확하지 않은 과정에서. 이 경우 신호는 신뢰할 수 없으며, 불필요한 손실이 발생할 수 있다.

  3. 중지 손실 설정의 위치와 비율은 수익의 결과에 큰 영향을 미칩니다. 중지 손실이 너무 작다면, 수축 위험이 있습니다. 중지 손실이 너무 크다면, 단일 손실이 너무 커질 수 있습니다. 최적의 변수를 찾기 위해 충분한 테스트가 필요합니다.

  4. 이동 평균은 트렌드 추적 지표로서, 가격이 빠르게 반전할 때, 그것의 지시 효용은 할인된다. 전략은 중단 손실에 이르지 못했을 때 가격 반전으로 타격되어 큰 손실을 초래한다.

그 해결책은 다음과 같습니다.

  1. 극심한 흔들림 상황에 맞게 이동 평균의 파라미터를 적절히 조정할 수 있으며, 낮은 파라미터의 EMA와 SMA를 사용하여 교차 횟수를 줄일 수 있다.

  2. MACD 0축 위아래의 돌파를 필터링하는 조건을 추가하면 가짜 돌파를 어느 정도 줄일 수 있다. 또한 KDJ, BOLL 등과 같은 다른 지표를 조합하는 것도 고려할 수 있다.

  3. 중단 손실 위치와 비율의 설정은 충분한 재검토와 최적화를 통해 최적의 파라미터를 찾을 수 있습니다. 이러한 기초에 따라 지속적인 모니터링과 동적 조정도 고려해야합니다.

  4. 가격의 급격한 반전을 식별하는 메커니즘을 설정할 수 있습니다. 비정상적인 반전이 발견되면, 포지션을 축소하거나 거래 전략을 일시 중단하는 긴급 조치를 취하여 위험 경로를 제어하십시오.

최적화 방향

이중 평평선 교차 트렌드 전략에는 다음의 몇 가지 측면에 초점을 맞추어 더 많은 최적화 할 여지가 있습니다.

  1. 더 많은 지표를 테스트하여 더 나은 파라미터를 찾습니다. 예를 들어 BOLL 채널을 도입하고 변동률의 영향을 고려합니다.

  2. 이동 평균의 길이 변수를 최적화하여 다양한 시장 조건에서 최적의 변수 조합을 찾습니다. 변수 롤링 최적화도 선택 사항입니다.

  3. 더 과학적으로 합리적으로 스톱 스톱 손실 전략을 설정하십시오. 예를 들어, 추적 스톱 손실을 도입하거나, 역사적인 통계 결과에 따라 동적 리스크 수익률을 설정하십시오. 이것은 전략의 안정성을 더욱 향상시킬 수 있습니다.

  4. 가격의 비정상적인 반향을 자동으로 인식하고 대응할 수 있는 장치를 구축한다. 극단적인 상황에서는 적극적으로 포지션을 축소하거나 전략을 중단하여 큰 손실을 피한다.

  5. 거래 품종에 대한 확장, 외환, 디지털 통화 등의 다른 품종. 다양한 품종의 매개 변수 강도를 테스트하고, 전략 적용 범위를 확장한다.

  6. 최적화 전략의 자금 관리 전략, 예를 들어, 수량 거래, 고정 위치 비율 등. 단일 손실 위험을 제어하여 전체 자금 곡선을 더 평평하게 만듭니다.

요약하다

쌍평선 교차 트렌드 전략은 복합적으로 다중 요소를 고려하고, 거래 신호를 발송할 때 가격, 트렌드 및 동력의 여러 지표의 지원이 필요하여 신호의 신뢰성을 보장한다. 전략은 또한 모바일 스톱 스톱을 사용하여 단편 거래의 위험을 효과적으로 제어한다. 이 전략의 파라미터는 설정이 유연하고 실용성이 강하며 자동화 거래에 적합하다.

그러나, 어떤 전략도 완벽 할 수 없습니다. 이 전략은 또한 자주 거래, 가짜 돌파구 및 중지 위치 설정과 같은 응용에서 몇 가지 어려움을 겪을 수 있습니다. 이것은 우리가 최적화 파라미터 포트폴리오, 새로운 기술 지표 포트폴리오를 도입하고, 손실 장치를 개선하는 등 여러 가지 측면에서 노력하여 전략의 안정성과 수익성을 더욱 강화해야합니다.

전체적으로, 쌍평선 교차 트렌드 전략은 비교적 완전하고 엄격한 거래 체계를 형성한다. 후속 연구와 응용에서, 이 전략은 지속적인 최적화 및 개선으로 더 큰 실전 가치를 발휘할 것으로 보인다.
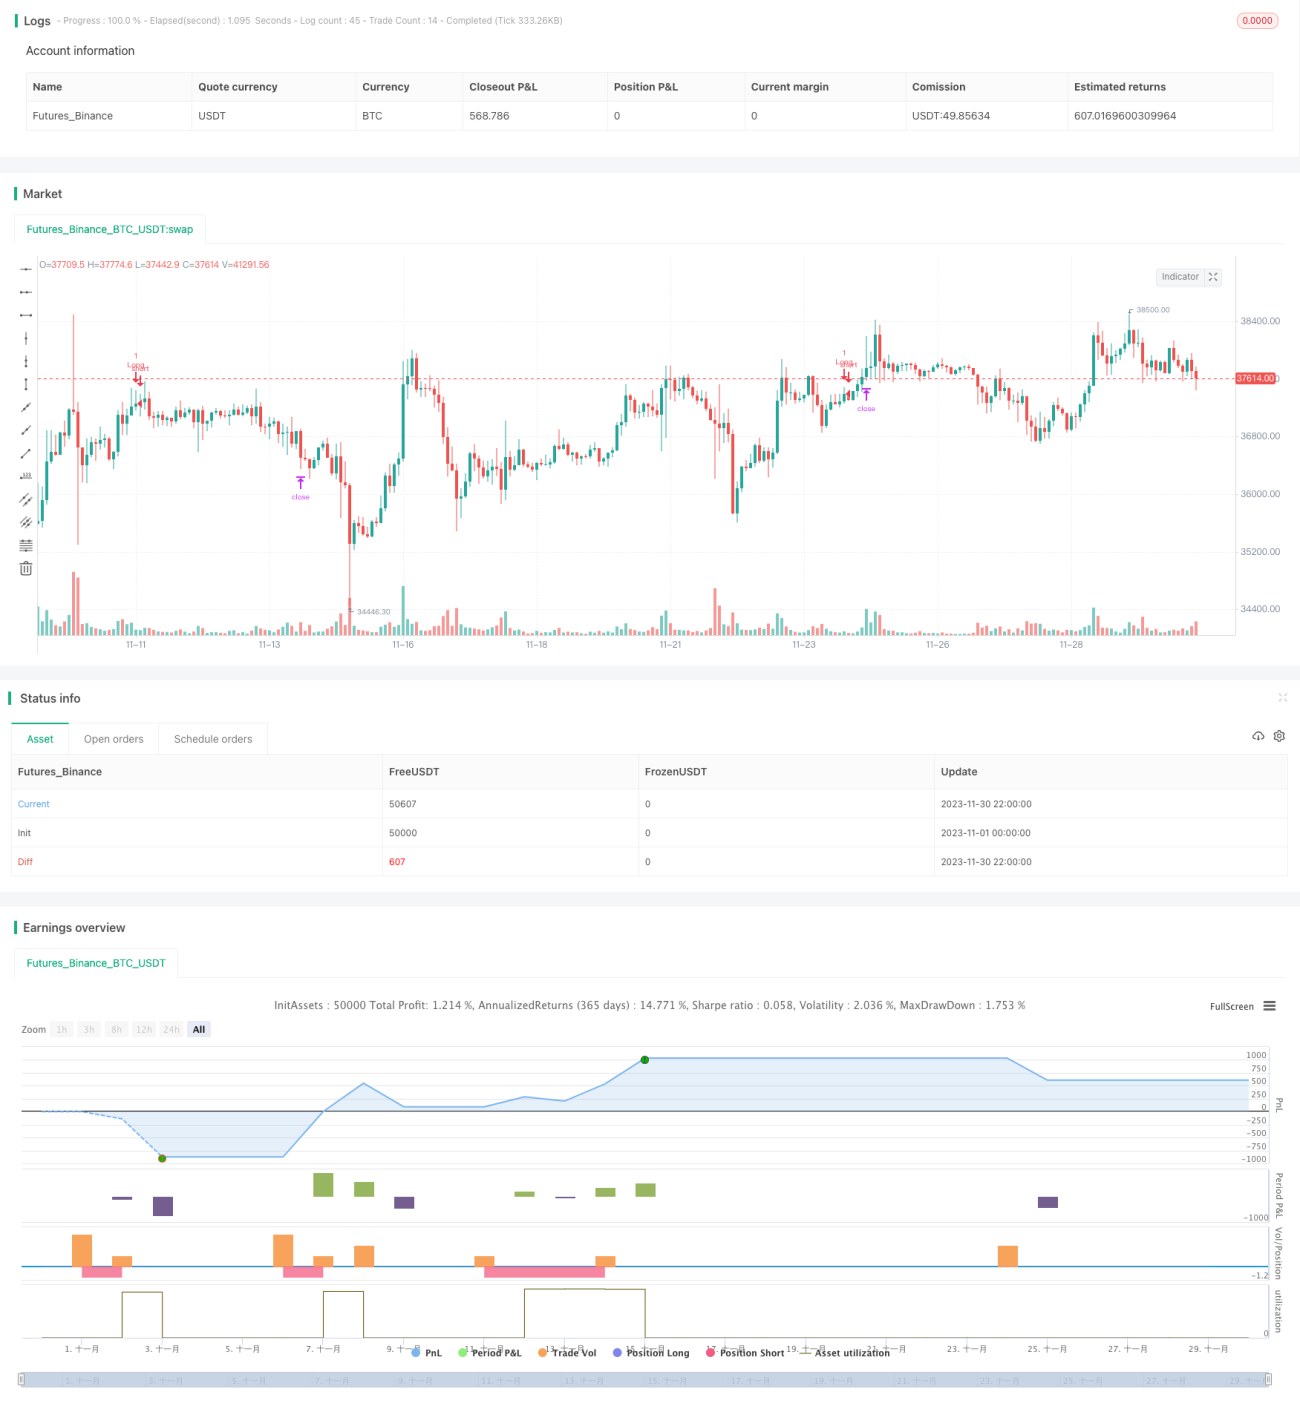
전략 소스 코드
/*backtest
start: 2023-11-01 00:00:00
end: 2023-11-30 23:59:59
period: 2h
basePeriod: 15m
exchanges: [{"eid":"Futures_Binance","currency":"BTC_USDT"}]
*/

//@version=4
// Hi,
// This is my first strategy made by myself(except for the MACD indicator). I'm publishing this to get myself out there and for some newer people to see how a basic strategy works. All credits go to Zen&TheArtofTrading, for teaching me almost everything I know about Pinescript
// The strategy is basically an MACD crossover trend strategy. If the MACD line crosses the signal line upward, above the zero point of the histogram, while the price is above 200 EMA and 100 SMA it's a buy signal
// If the MACD line crosses the signal line downward, while below zero point of the histogram, as well as the price being below 200 EMA and 100 SMA it's a sell signal
// I used the 200 EMA and 100 SMA because I wanted to filter weak signals as much as possible when the market is ranging, if you have any suggestions to go around this better, please let me know, still learning everyday

// If you have any suggestions, tips or tricks please let me know. I'm still new to Pinescript, but having a lot of fun trying stuff out. If you see something in my code that you don't understand, feel free to ask, I'll try to answer as best as I can

// I opened the strategy with predetermined backtesting pyramiding, currency etc. This made the progress of backtesting multiple TP and SL easier. Also the commission value is from Binance Futures, I just left it in there for anyone who wants to just copy this strategy
strategy("MACD Crossover Trend Strategy Template", overlay = true )

// Determining inputs and values, I just copied the built-in MACD strategy and removed everything I didn't need, just needed the barebone indicator and added EMA + SMA inputs
fast_length = input(title = "Fast Length", type = input.integer, defval = 12, group = "MACD Values")
slow_length = input(title = "Slow Length", type = input.integer, defval = 26, group = "MACD Values")
src = input(title = "Source", type = input.source, defval = close, group = "MACD Values")
signal_length = input(title = "Signal Smoothing", type=input.integer, minval = 1, maxval = 50, defval = 9, group = "MACD Values")
sma_source = input(title = "Simple MA (Oscillator)", type = input.bool, defval = false, group = "MACD Values")
sma_signal = input(title = "Simple MA (Signal Line)", type = input.bool, defval = false, group = "MACD Values")
fast_ma = sma_source ? sma(src, fast_length) : ema(src, fast_length)
slow_ma = sma_source ? sma(src, slow_length) : ema(src, slow_length)
macd = fast_ma - slow_ma
signal = sma_signal ? sma(macd, signal_length) : ema(macd, signal_length)
hist = macd - signal
emaLength = input(title = "EMA", type = input.integer, defval = 200, step = 10, group = "Moving Averages")
smaLength = input(title = "SMA", type = input.integer, defval = 100, step = 10, group = "Moving Averages")

// Input backtest range, you can adjust this here or in the input options
fromMonth = input(defval = 1,    title = "From Month",      type = input.integer, minval = 1, maxval = 12, group = "Backtest Date Range")
fromDay   = input(defval = 1,    title = "From Day",        type = input.integer, minval = 1, maxval = 31, group = "Backtest Date Range")
fromYear  = input(defval = 2000, title = "From Year",       type = input.integer, minval = 1970, group = "Backtest Date Range")
thruMonth = input(defval = 1,    title = "Thru Month",      type = input.integer, minval = 1, maxval = 12, group = "Backtest Date Range")
thruDay   = input(defval = 1,    title = "Thru Day",        type = input.integer, minval = 1, maxval = 31, group = "Backtest Date Range")
thruYear  = input(defval = 2099, title = "Thru Year",       type = input.integer, minval = 1970, group = "Backtest Date Range")

// Inputs for EMA, SMA and to adjust your take profit and stop losses in the input options while backtesting, it's result of your input is calculated back to percentages
ema = ema(close, emaLength)
sma = sma(close, smaLength)
profitlong = input(title = "Profit Long %", type = input.float, defval = 2, minval = 0.1, maxval = 100, step = 0.1, group = "TP / SL %") * 0.01
losslong = input(title = "Loss Long %", type = input.float, defval = 1, minval = 0.1, maxval = 100, step = 0.1, group = "TP / SL %") * 0.01
profitshort = input(title = "Profit Short %", type = input.float, defval = 2, minval = 0.1, maxval = 100, step = 0.1, group = "TP / SL %") * 0.01
lossshort = input(title = "Loss Short %", type = input.float, defval = 1, minval = 0.1, maxval = 100, step = 0.1, group = "TP / SL %") * 0.01

// Check EMA and SMA also check the backtest range. inDataRange is a true or false statement, true if the date right now is between the parameters that's filled at the corresponding inputs
// (for example 1-1-2020 till 12-12-2020, if that specific bar is between these dates, statement is true and trade will be executed)
// If the date is not in between the given parameters, statement turns to false and it won't allow new trades and closes all current trades as seen with the strategy.close_all function
inDataRange = (time >= timestamp(syminfo.timezone, fromYear, fromMonth, fromDay, 0, 0)) and (time < timestamp(syminfo.timezone, thruYear, thruMonth, thruDay, 0, 0))
long = close > ema and close > sma and inDataRange
short = close < ema and close < sma and inDataRange

// Entry and exit signals + checking backtest date range, what the signals are supposed to do is noted at the beginning of the code
// I want a way to filter out weak signals that are ranging around the zero point of the histogram. 
// So far couldn't think of a decent way to do this over multiple symbols since the range of the histogram changes with every symbol, sometimes ranging between 0 and 1 or sometimes ranging between 0 and 1000
// I could probably use a cofficiency or something, but that's beyond my grasp at the moment
// Also I wanted a way to let my strategy determine a stop loss based on the pullback and having a 1.5 risk/reward TP on top of that. Couldn't really figure out a way to determine the pullback
if (crossover(macd, signal) and macd > 0)
    strategy.entry("Long", long = strategy.long,
     comment = "Long Buy",
     when = long)

strategy.exit("Exit Long", "Long", profit = close * profitlong / syminfo.mintick, loss = close * losslong / syminfo.mintick)


if (crossunder(macd, signal) and macd < 0)
    strategy.entry("Short", long = strategy.short,
     comment = "Short Buy",
     when = short)

strategy.exit("Exit Short", "Short", profit = close * profitshort / syminfo.mintick, loss = close * lossshort / syminfo.mintick)

// To make sure the backtesting doesn't leave a position open beyond, or before, our applied dates
if (not inDataRange)
    strategy.close_all()

// plot(strategy.equity, title="equity", color=color.red, linewidth=2, style=plot.style_areabr)