三重SuperTrend와 Stoch RSI 전략

개요
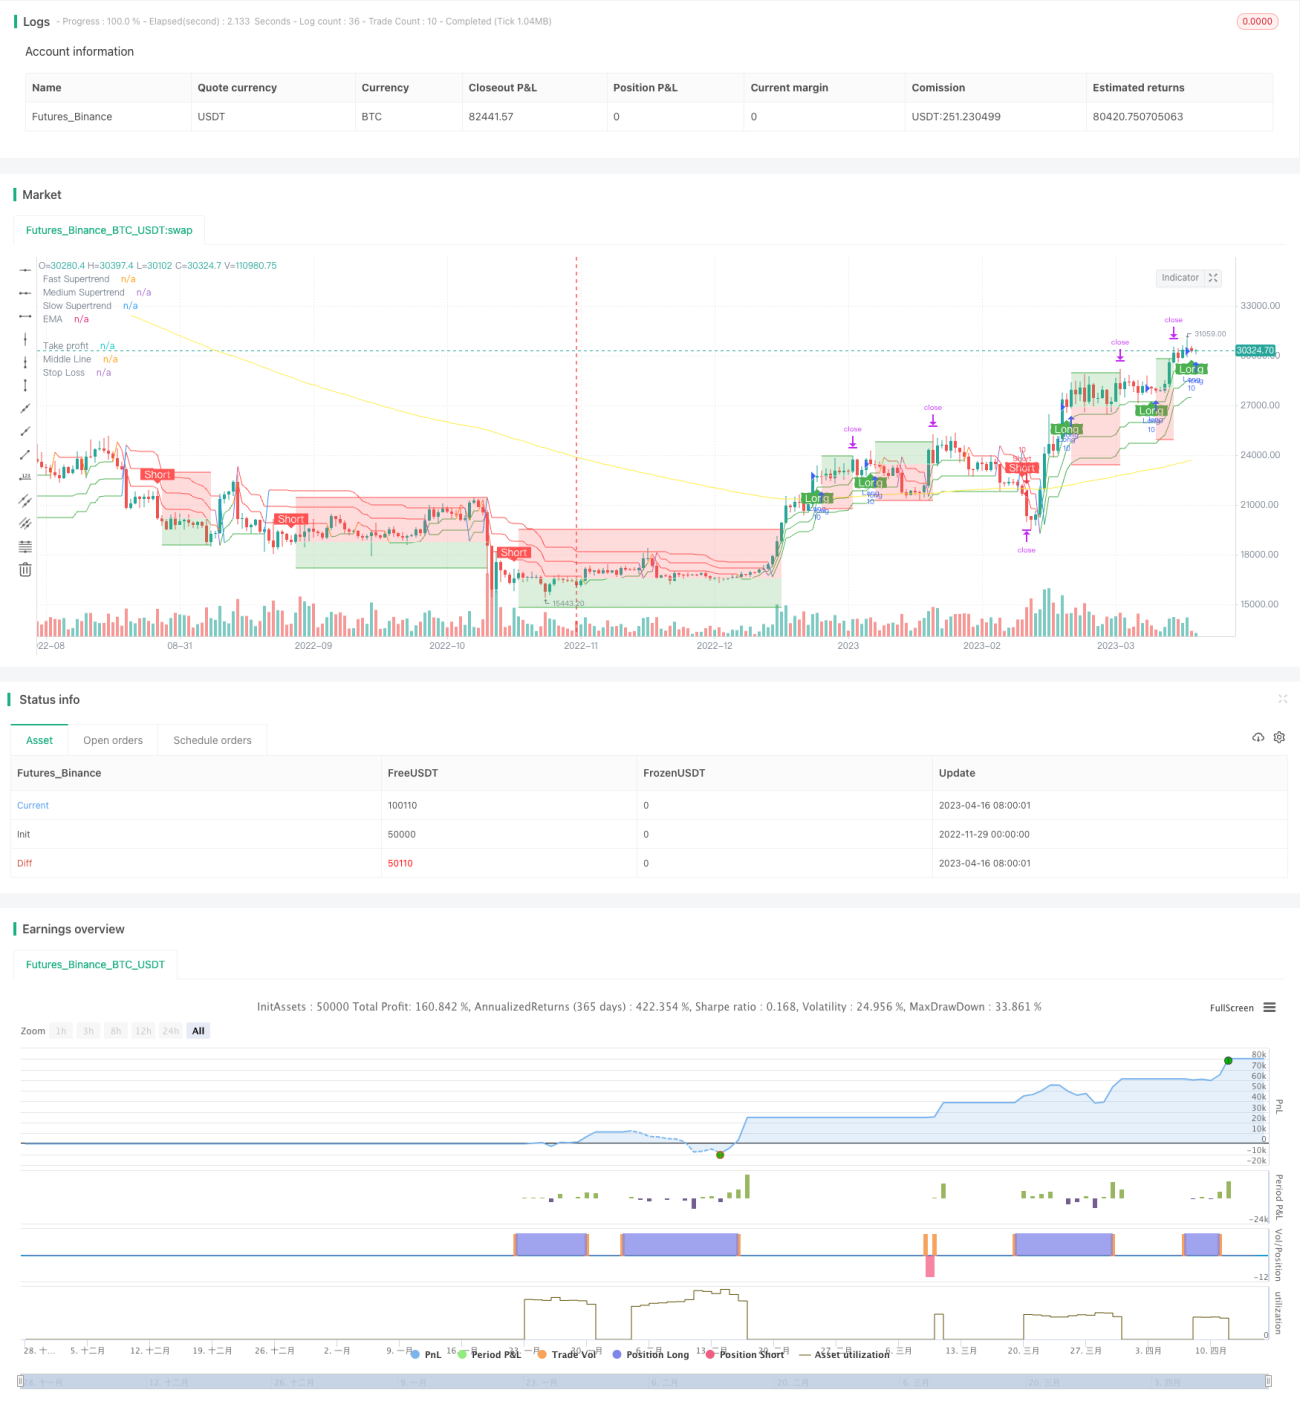
트리플 슈퍼트렌드(SuperTrend)와 스토크 RSI(Stoch RSI) 전략은 다중 시간 프레임의 추세 추종 및 과매수/과매도 지표를 결합한 정량적 거래 전략입니다. 이 전략은 서로 다른 매개변수 설정을 가진 세 개의 슈퍼트렌드 지표를 사용하여 시장 추세를 판단하고, 스토크 RSI 지표의 과매수/과매도 신호와 결합하여 거래 신호를 발생시킵니다. 구체적으로, 두 개의 빠른 슈퍼트렌드 지표가 동시에 매수/매도 신호를 발생시킬 때, 스토크 RSI 지표도 해당 신호를 확인하면 롱/숏 포지션을 취합니다.
전략 원리
트리플 슈퍼트렌드와 스토크 RSI 전략의 핵심 논리는 서로 다른 매개변수 설정의 슈퍼트렌드 지표와 스토크 RSI 지표를 결합하여 거래 신호를 필터링함으로써 신호 품질을 높이고 오류 신호 비율을 낮추는 것입니다.
먼저, 이 전략은 서로 다른 매개변수를 가진 세 그룹의 슈퍼트렌드 지표를 사용하여 시장의 주요 추세를 판단합니다. 이 세 그룹의 슈퍼트렌드 지표는 매개변수 설정이 다르며, 시간 프레임이 빠른 것부터 느린 것까지 다양한 수준의 추세 변화를 포착합니다. 가장 빠른 것과 두 번째로 빠른 슈퍼트렌드 지표가 동시에 매수/매도 신호를 발생시키면 해당 신호가 일정 수준의 신뢰성을 가지고 있다고 판단합니다.
둘째, 전략은 스토크 RSI 지표를 도입하여 해당 신호가 과도하게 과매수 또는 과매도 상태인지 판단합니다. 스토크 RSI 지표는 RSI(상대강도지수)와 스토캐스틱 지표의 장점을 결합하여 시장이 과매수 또는 과매도 상태인지 효과적으로 판단할 수 있습니다. 가장 빠른 것과 두 번째로 빠른 슈퍼트렌드 신호가 스토크 RSI 지표 신호와 일치하면 최종 매수/매도 신호를 발생시킵니다.
다중 지표와 다중 시간 프레임의 결합을 통해 트리플 슈퍼트렌드와 스토크 RSI 전략은 시장 노이즈를 효과적으로 필터링하고 신호의 신뢰성을 높이며 잘못된 거래 발생을 줄일 수 있습니다.
전략 장점
트리플 슈퍼트렌드와 스토크 RSI 전략의 가장 큰 장점은 다중 지표와 다중 시간 프레임의 효과적인 결합으로, 다음과 같은 이점을 제공합니다:
-
잘못된 거래 신호 감소. 세 개의 슈퍼트렌드 지표와 스토크 RSI 지표의 결합은 단일 지표가 가진 노이즈 신호와 오류 신호를 크게 줄일 수 있습니다.
-
수익성 있는 신호 비율 증가. 신호 빈도는 낮아지지만 수익성 있는 신호의 비율이 현저히 증가합니다.
-
추세 시장에 적합. 다중 시간 프레임 필터링은 중장기 추세를 포착하는 데 유리하며, 추세가 뚜렷한 시장 환경에 적합합니다.
-
매개변수 최적화를 통해 더 나은 결과를 얻기 용이. 세 가지 지표는 매개변수 최적화에 더 큰 가능성 공간을 제공합니다.
-
개인 스타일에 따라 매개변수 조정 가능. 매개변수를 자유롭게 조정하여 전략을 자신의 거래 스타일에 더 잘 맞출 수 있습니다.
전략 위험
트리플 슈퍼트렌드와 스토크 RSI 전략에는 다음과 같은 몇 가지 위험도 존재합니다:
-
신호 빈도 감소. 다중 필터링 메커니즘으로 인해 전략의 거래 빈도가 현저히 낮아집니다.
-
일부 신호를 놓치기 쉬움. 전략의 보수적인 성격으로 인해 잠재적 기회의 일부를 놓칠 수 있습니다.
-
다중 지표가 매개변수 의존성을 증가시킴. 지표와 매개변수가 많을수록 전략 최적화 난이도도 커집니다.
-
추종 능력이 제한적. 다중 시간 프레임 결합은 전략의 추세 추종 유연성을 제한합니다.
위와 같은 위험에 대응하기 위해 지표 매개변수를 조정하고, 더 많은 보조 판단 지표를 도입하는 등의 최적화를 통해 위험을 통제하면서 더 높은 수익 품질을 얻을 수 있습니다.
전략 최적화 방향
트리플 슈퍼트렌드와 스토크 RSI 전략은 다음과 같은 측면에서 더욱 최적화할 여지가 있습니다:
-
지표 매개변수 조합 조정, 최적의 매개변수 매칭 탐색. 더 많은 지표 매개변수 그룹을 테스트하여 최적의 매개변수를 찾을 수 있습니다.
-
손절매 및 이익실현 전략 추가, 단일 거래 위험 통제. 이는 전략의 안정성을 크게 향상시킬 수 있습니다.
-
더 많은 판단 지표 도입하여 신호 검증. 거래량 지표 등을 도입하여 다양한 각도에서 판단할 수 있습니다.
-
적응형 기능 추가. 전략이 자동으로 매개변수를 최적화하고 조정하여 시장 변화에 적응할 수 있도록 합니다.
-
머신러닝 알고리즘 결합하여 예측. AI 알고리즘을 사용하여 지표 신호의 정확성을 예측합니다.
지속적인 최적화를 통해 트리플 슈퍼트렌드와 스토크 RSI 전략은 안정적이고 효율적인 정량적 거래 전략으로 성장하여 상당한 알파를 창출할 수 있습니다.
요약
트리플 슈퍼트렌드와 스토크 RSI 전략은 다중 시간 프레임 분석과 과매수/과매도 판단을 성공적으로 결합하여 독특한 추세 추종형 거래 전략을 형성했습니다. 이 전략은 추세 추종과 지표 필터링이라는 이중 장점을 동시에 유지하며, 노이즈 신호를 줄이면서 수익성 있는 신호의 비율을 높였습니다. 이 전략에 위험과 최적화 여지가 여전히 존재하지만, 매개변수 조정과 전략 최적화를 통해 수익성과 안정성을 더욱 향상시킬 수 있습니다. 전반적으로 트리플 슈퍼트렌드와 스토크 RSI 전략은 정량적 거래 실무에 고품질의 전략 선택지를 제공합니다.
- 1