RSI를 기반으로 한 양적 거래 전략

1
Follow
1778
Followers
개요
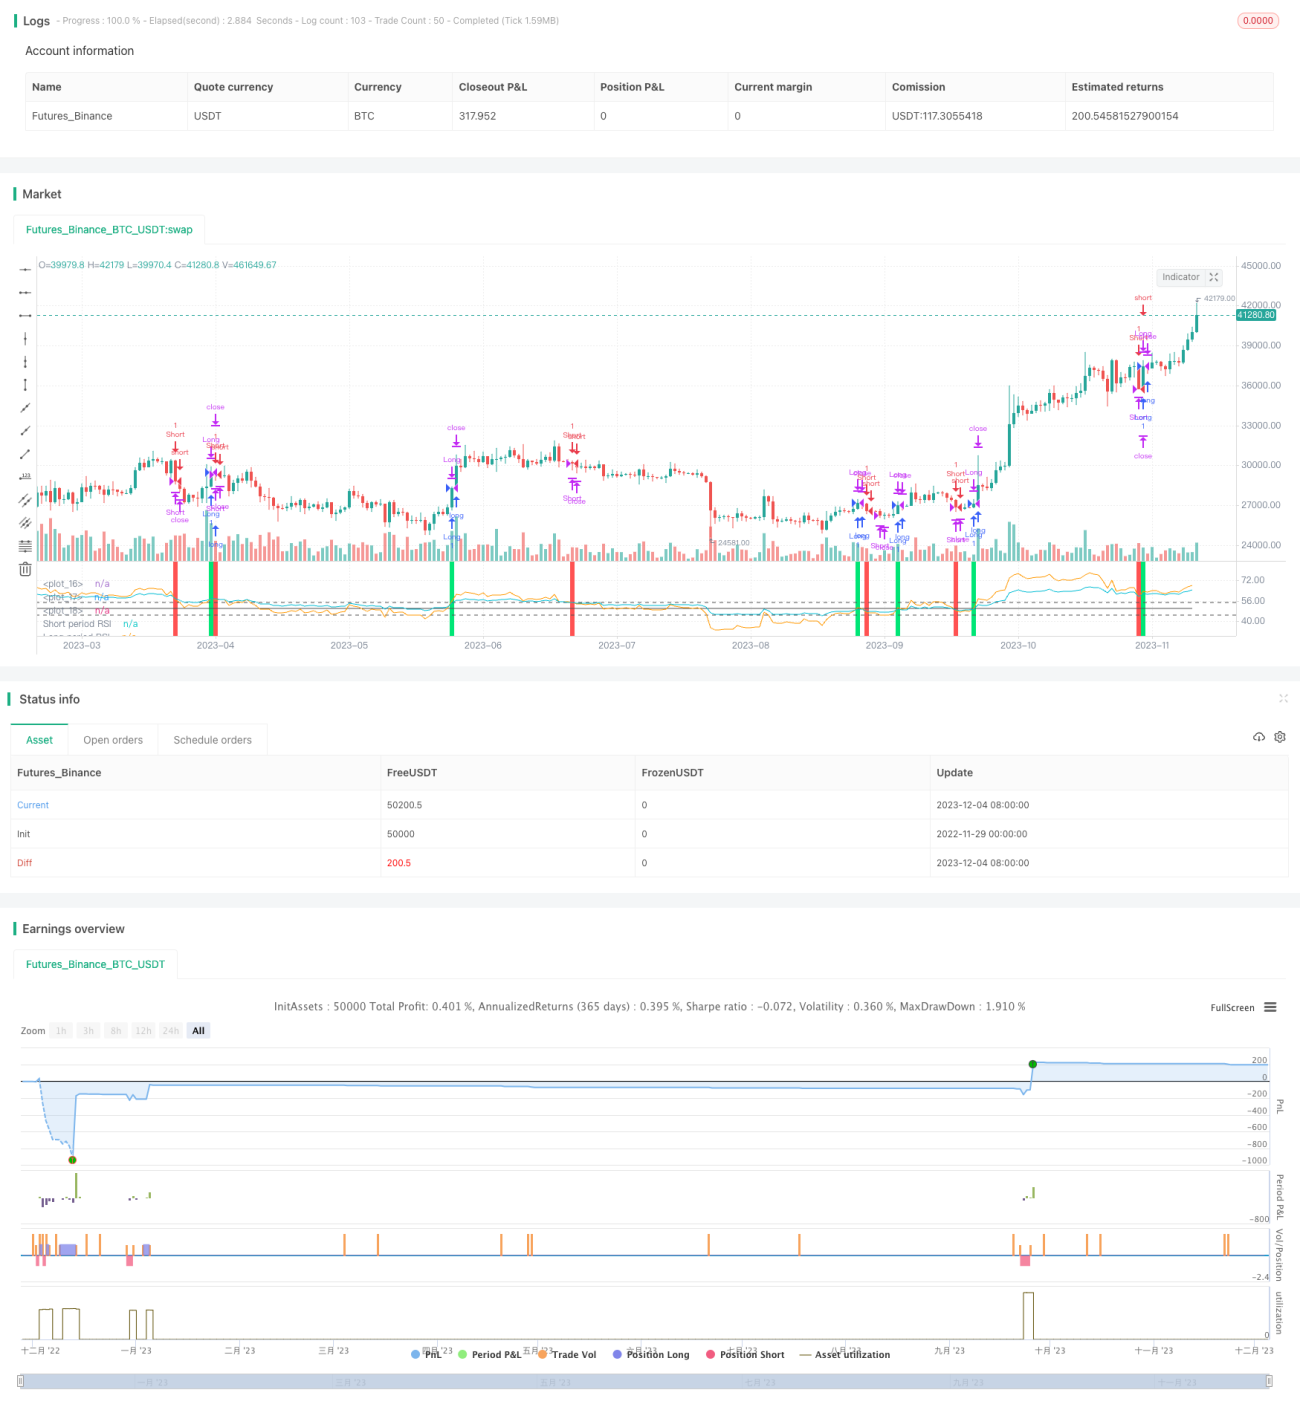
이 전략은 양축 시간축 RSI 반전이라고 불리며, 상대 강도 지수 ((RSI) 를 기반으로 한 정량 거래 전략이다. 이 전략은 두 개의 다른 주기 RSI를 구매 및 판매 신호로 사용하여, 낮은 구매 및 높은 판매를 달성하고, 주식 가격 반전의 거래 기회를 획득한다.
전략 원칙
이 전략은 빠른 주기를 이용하여 ((전설 55일) RSI와 느린 주기를 이용하여 ((전설 126일) RSI를 사용하여 거래 신호를 구성한다. 빠른 주기를 RSI 위에 두고 느린 주기를 RSI를 통과할 때 구매 신호를 생성하고, 반대로 빠른 주기를 RSI 아래에 두고 느린 주기를 RSI를 통과할 때 판매 신호를 생성한다. 이렇게 두 개의 다른 시간대 사이의 가격 동력의 상대적으로 강한 것을 비교하여 단기 및 장기적인 트렌드 반전 기회를 발견한다.
신호가 들어간 후, 전략은 중지 중지 손실을 설정합니다. 중지 중지 값은 입력 가격의 0.9배이며, 중지 손실 값은 입력 가격의 3%입니다. 역전 신호가 다시 발생하면 현재 위치를 평행합니다.
전략적 이점
- 이중 RSI 비교를 사용하여 단기 및 장기 가격 동향의 변화점을 발견하고 역전 기회를 잡습니다.
- 이중 RSI는 가짜 돌파구로 인한 잡음 거래를 제거합니다.
- 단편적 손실을 제한할 수 있는 스톱 스톱 지점을 구성합니다.
전략적 위험
- RSI 신호는 주가가 급격하게 변동하는 동안 자주 반전될 수 있습니다.
- 소규모의 스톱포인트로 인해 작은 진동 후에 손실이 발생할 수 있습니다.
- 이중 RSI 파라미터가 잘못 설정되어 큰 반향을 놓칠 수 있습니다.
전략 최적화
- RSI 변수는 더 많은 조합을 테스트하여 최적의 변수를 찾을 수 있습니다.
- 다른 지표와 함께 필터링할 수 있다.
- 동적으로 정지 손실 비율을 조정하여 더 유연한 정지
요약하다
이 전략은 쌍시계 RSI 역전 (RSI Reversal) 을 비교하여 빠른 주기와 느린 주기의 두 RSI를 교차하여 거래 신호로 삼고, 단기 가격 역전 기회를 잡는 것을 목표로 한다. 동시에 스톱 손실 규칙을 설정하여 위험을 회피한다. 이것은 지표의 다중 시간 축 비교를 사용하여 가격 역전 거래를 실현하는 전형적인 전략이다. 최적화 공간은 파라미터 조정과 위험 관리 규칙을 최적화한다.
Source
Pine
/*backtest
start: 2022-11-29 00:00:00
end: 2023-12-05 00:00:00
period: 1d
basePeriod: 1h
exchanges: [{"eid":"Futures_Binance","currency":"BTC_USDT"}]
*/

//@version=2
strategy(title="Relative Strength Index", shorttitle="RSI")
slen    = input(55, title="Short length")
llen = input(126, title="Long length")Strategy parameters
Related strategies
Comment
All comments (0)
No data
- 1