이동평균 골든크로스와 데드크로스를 기반으로 한 트레이딩 전략

개요
이 전략은 BTC의 50일 이동 평균과 200일 이동 평균의 금叉死叉 신호를 기반으로, 추가적인 기술 지표 판단과 함께 구매 및 판매 신호를 발산한다. 이 전략은 주로 BTC/USDT와 같은 명백한 추세적 특성을 가진 통화 쌍에 적용된다.
전략 원칙
50일 이동 평균 상위에서 200일 이동 평균을 뚫고 금동 포크가 형성되면, BTC가 다단계 시장에 진입하여 구매 신호를 발생시킨다는 것을 나타냅니다. 그리고 50일 이동 평균이 아래로 200일 이동 평균을 뚫고 정지 포크가 형성되면, BTC가 공허 시장에 진입하여 판매 신호를 발생시킨다는 것을 나타냅니다.
이 전략은 기본 이동 평균의 금색 포크와 정지 포크 신호 판단 이외에, 판단을 보조하는 몇 가지 추가 기술 지표가 추가되었습니다.
-
EMA 지수: length+offset의 EMA 지수를 계산하여, 상승할 때 현재 다단 시장에 있다는 것을 나타내고, 구매할 수 있다.
-
이동 평균과 EMA의 수학적 관계를 비교: 50일 이동 평균보다 높은 EMA 값이 있으면 구매 판단이 발생한다.
-
가격 확인은 전 K 선의 최저점보다 1% 이상 떨어지고, 만족하면 판매 신호를 발생시킨다.
위와 같은 몇 가지 지표들을 조합하여 잘못된 신호를 필터링하여 전략적 거래 결정을 더욱 신뢰할 수 있습니다.
우위 분석
이 전략에는 다음과 같은 장점이 있습니다.
-
이동 평균을 주요 거래 신호로 사용하여 시장 소음을 필터링하고 트렌드 방향을 식별 할 수 있습니다.
-
EMA와 같은 여러 보조 기술 지표와 결합하여 신호의 신뢰성을 높이고, 가짜 신호를 필터링할 수 있다.
-
적절한 손실을 막는 전략으로 단독 손실을 효과적으로 통제할 수 있습니다.
-
간단한 거래 논리, 이해하기 쉬운 구현, 양자 거래 초보자에게 적합하다.
-
더 많은 파라미터를 구성할 수 있으며, 자신의 취향에 따라 조정할 수 있다.
위험 분석
이 전략에는 몇 가지 위험도 있습니다.
-
이동 평균은 그 자체로 지연성이 강하며, 가격의 급격한 반전을 놓칠 수 있다.
-
보조 지표는 규칙의 수를 증가시키고 잘못된 신호를 생성할 확률을 높여줍니다.
-
부적절한 스톱로스 설정으로 손실이 커질 수 있습니다.
-
매개 변수 설정 (예를 들어 이동 평균 길이는) 이 잘못되면 전략 효과에도 영향을 미칠 수 있다.
대응방법:
-
이동 평균 주기를 적절히 줄이고, 파라미터 최적화 범위를 확대한다.
-
데이터의 양을 늘리고, 신호의 질을 검사한다.
-
적당히 느슨한 스톱로스 범위를 설정하고, 동시에 수익 스톱을 설정한다.
-
더 많은 변수 최적화를 통해 최적의 변수 조합을 찾아보세요.
최적화 방향
이 전략은 다음과 같은 방향으로 최적화될 수 있습니다.
-
기계 학습 알고리즘을 추가하여 매개 변수의 자동 최적화를 구현한다.
-
더 많은 보조 지표를 추가하고, 여러 가지 세부 전략을 수립하고, 투표 메커니즘을 통해 결정을 내립니다.
-
브레이크아웃을 시도하여 가격 돌파구를 식별하십시오.
-
딥러닝을 활용하여 가격 동향을 예측하십시오.
-
손해 차단 메커니즘을 최적화하여 동적 추적 손해 차단을 구현하십시오.
이러한 최적화는 의사 결정의 정확성을 높이고, 전략의 수익성과 안정성을 강화할 수 있다.
요약하다
이 전략은 주로 BTC의 이동 평균 교차를 기반으로 거래 결정을 내리고, EMA와 같은 기술 지표로 신호를 필터링한다. 이 전략은 강력한 트렌드 추적 능력을 가지고 있으며, 구성성이 높으며, 양적 거래의 입문 전략으로 적합하다. 그러나 또한 약간의 지연 위험이 있으며, 주의해야 한다.
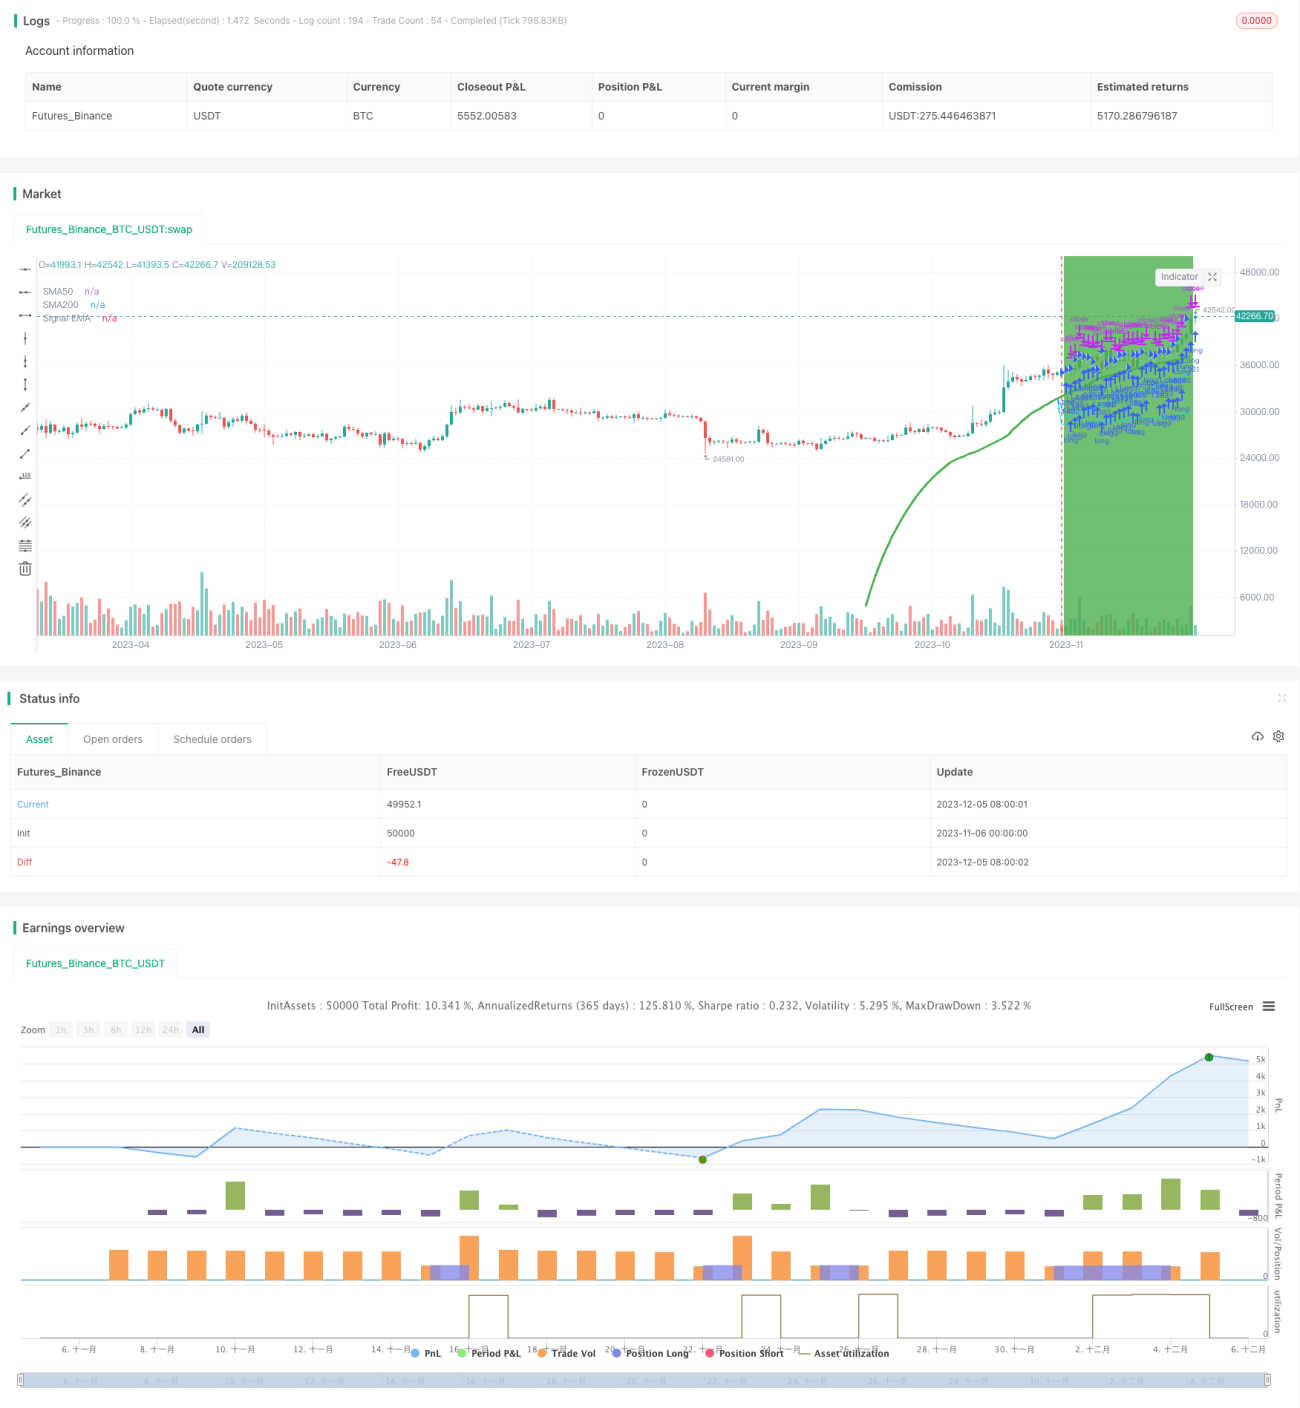
/*backtest
start: 2023-11-06 00:00:00
end: 2023-12-06 00:00:00
period: 1d
basePeriod: 1h
exchanges: [{"eid":"Futures_Binance","currency":"BTC_USDT"}]
*/

//@version=5
strategy('JayJay BTC Signal', overlay=true, initial_capital=100, currency='USD', default_qty_value=100, default_qty_type=strategy.percent_of_equity, commission_value=0, calc_on_every_tick=true)

securityNoRepaint(sym, tf, src) => request.security(sym, tf, src[barstate.isrealtime ? 1 : 0])[barstate.isrealtime ? 0 : 1]- 1