
스피럴 오스파일러 트렌드 추적 전략은 스피럴 지표에 기반한 트렌드 추적 전략이다. 그것은 여러 개의 다른 주기의 이동 평균을 사용하여 스피럴 지표를 구성하여 가격의 잠재적인 트렌드를 식별하고, 더 짧은 주기의 이동 평균을 보조 판단으로 결합하여 낮은 위험의 트렌드 추적 작업을 수행한다.
이 전략의 핵심 지표는 휘파람 지표이다. 휘파람 지표는 여러 다른 기간의 단기, 중기 및 장기 이동 평균으로 구성되어 있다. 구체적으로, 전략은 6일, 27일, 72일 및 234일 4주기의 이동 평균을 사용했다. 단기 이동 평균은 가격의 최신 추세를 반영하고, 장기 이동 평균은 가격의 장기 추세를 반영한다. 지표의 핵심 논리는, 단기 이동 평균을 가로질러 장기 이동 평균을 가로질러 가격 상승 동력을 강화하면 구매해야 하며, 단기 이동 평균을 가로질러 장기 이동 평균을 가로질러 가격 상승 동력을 약화하면 판매해야 한다는 것이다.
소용돌이 지표의 눈에 띄는 장점은 트렌드를 정확하게 판단하고, 시장의 잡음을 효과적으로 필터링 할 수 있다는 것입니다. 그러나 반응이 충분히 민감하지 않아 전환점을 적시에 잡을 수 없습니다. 따라서 전략은 더 민감한 6 일 이동 평균을 추가하여 보조 판단 지표를 구축합니다. 소용돌이 지표와 보조 지표가 0축을 위쪽으로 이동할 때 구매하고, 0축을 아래로 이동할 때 판매합니다. 이것은 트렌드 방향과 강도를 판단하는 소용돌이 지표를 형성합니다.
이 전략의 가장 큰 장점은 판단의 정확성, 조작의 민감성이다. 회전 지표와 보조 지표의 결합은 트렌드 판단과 구체적인 매수점을 결정하는 유기적 통일을 실현하고, 각 지점의 직무는 상호 간섭을 피한다. 다중 확인 메커니즘은 시장 소음을 효과적으로 필터링하여 잘못된 조작을 방지한다. 동시에 보조 지표의 포함은 전략의 조작의 민감성을 보장한다.
단일 지표 전략에 비해, 이 전략은 복합적으로 여러 지표의 장점을 적용하여 시장 변화에 대한 인식과 대응 능력이 강하다. 큰 추세가 변하지 않는 경우, 전략은 안정적인 수익을 달성할 수 있다. 큰 추세가 변할 때, 전략은 신속하게 반응하여 손실을 줄일 수 있다.
이 전략의 주요 위험은 지표 매개 변수 설정이 잘못되어 갑작스러운 사건의 영향에 있습니다. 이동 평균 매개 변수 설정은 민감성 및 노이즈 간섭에 대한 저항력을 밸런스를 요구합니다. 만약 매개 변수 설정이 잘못되면 전략 행동이 비정상화 될 수 있습니다. 또한, 중대한 갑작스러운 사건은 가격의 급격한 변동으로 인해 지표가 무효화되어 잘못된 거래가 발생할 수 있습니다.
이러한 위험을 줄이기 위해, 최적화 변수 조합과 재검토를 수행하여 지표의 성과를 더 안정적으로 유지하도록 권장합니다. 또한 중요한 사건으로 인한 시장 영향에 주의를 기울이고, 필요한 경우 전략을 중단하고, 비정상적인 변동 기간의 잘못된 조작을 피해야합니다. 가격 추세가 하락할 때 포지션을 점진적으로 줄이는 것도 효과적인 보증 수단입니다.
이 전략은 다음과 같은 부분에서 최적화될 수 있습니다.
이동 평균 파라미터를 최적화하여 지표의 방해 방지 능력과 조작 감수성을 향상시킨다. 다양한 길이 파라미터의 조합을 시도하여 평평하고 민감한 지표를 선택할 수 있다.
손해 제도를 늘리십시오. 가격이 불리한 방향으로 중요한 지원을 뚫을 때, 더 많은 손실을 방지하기 위해 손해 지점을 설정하십시오.
다른 지표 판단과 결합하여 전략 안정성을 높인다. 예를 들어 거래량 지표를 추가하면 거래량이 커지면 거래 신호가 발생한다.
시장의 다른 단계에 따라 다른 파라미터 조합을 사용합니다. 예를 들어, 황소 시장에서는 더 적극적인 파라미터를 사용하고, 곰 시장에서는 더 안정적인 설정을 사용합니다.
스피어스 오스파일러 트렌드 추적 전략은 가격 트렌드 방향과 강도를 판단하는 스피어스 지표를 사용하며, 보다 민감한 단기 이동 평균을 보조하여 구체적인 매매 시점을 결정한다. 이 전략은 성공적으로 트렌드 판단과 거래 실행의 두 차원을 결합하여, 운영의 안정성을 보장하고, 전략의 유연성을 향상시킨다. 매개 변수 최적화, 스톱 로즈 설정 및 상태 메커니즘의 도입을 통해 전략의 위험 저항성을 더욱 강화하여 더 우수한 재측 지표와 실장 성능을 얻을 수 있다.
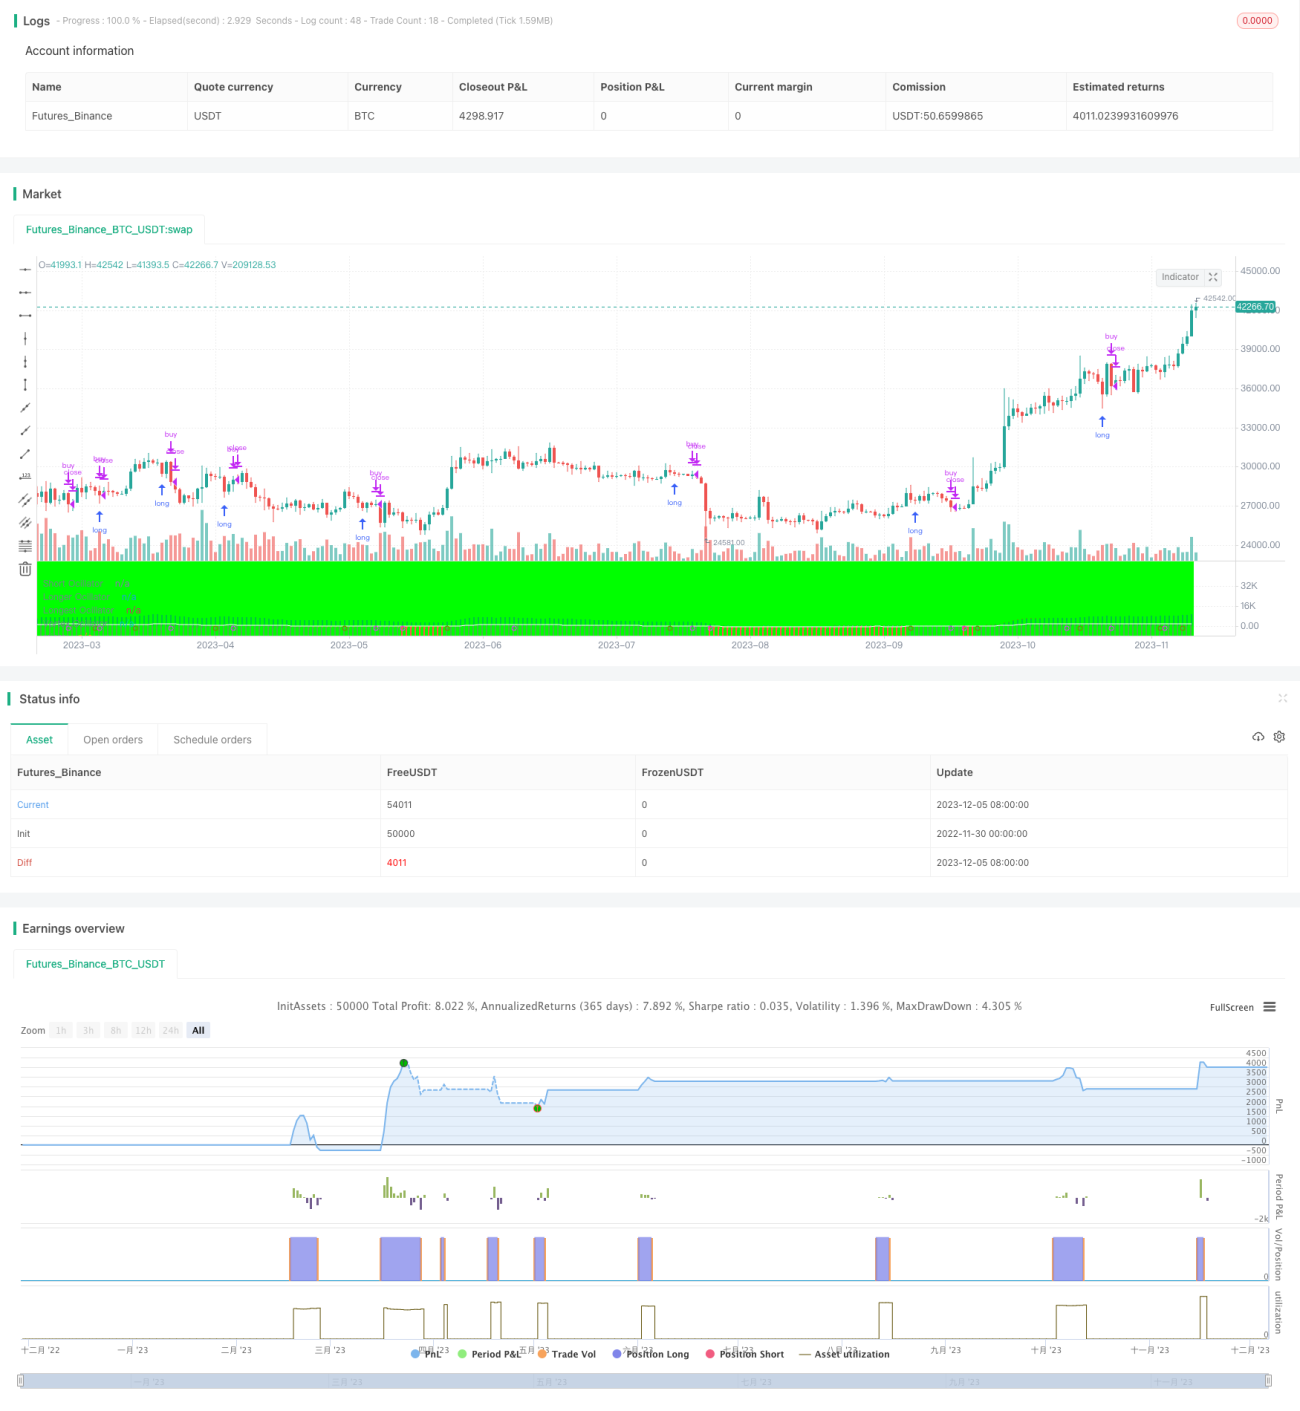
/*backtest
start: 2022-11-30 00:00:00
end: 2023-12-06 00:00:00
period: 1d
basePeriod: 1h
exchanges: [{"eid":"Futures_Binance","currency":"BTC_USDT"}]
*/
//@version=3
//swap strategy line for study line to enable backtesting
strategy(title="Vortex Ocillator" )
//study(title = "Vortex Oscillator", precision = 6)
// Component Code Start
// Example usage:
// if testPeriod()
// strategy.entry("LE", strategy.long)
testStartYear = input(2017, "Backtest Start Year")
testStartMonth = input(01, "Backtest Start Month")
testStartDay = input(2, "Backtest Start Day")
testPeriodStart = timestamp(testStartYear,testStartMonth,testStartDay,0,0)
testStopYear = input(2048, "Backtest Stop Year")
testStopMonth = input(7, "Backtest Stop Month")
testStopDay = input(30, "Backtest Stop Day")
testPeriodStop = timestamp(testStopYear,testStopMonth,testStopDay,0,0)
// A switch to control background coloring of the test period
testPeriodBackground = input(title="Color Background?", type=bool, defval=true)
testPeriodBackgroundColor = testPeriodBackground and (time >= testPeriodStart) and (time <= testPeriodStop) ? #00FF00 : na
bgcolor(testPeriodBackgroundColor, transp=97)
testPeriod() => true
// Component Code Stop
//vortex histogram
short_input = input(6, minval = 1)
long_input = input(27, minval = 1)
longer_input = input(72, minval = 1)
longest_input = input(234, minval = 1)
short = sma(close, short_input)
long = sma(close, long_input)
longer = sma(close, longer_input)
longest = sma(close, longest_input)
hist = short - long
longhist = short - longer
longesthist = short - longest
hist_fractal = input(3, minval = 0)
longhist_fractal = input(2, minval = 0)
longesthist_fractal = input(4, minval = 0)
vortexhist = avg((hist / hist_fractal), (longhist / longhist_fractal), (longesthist / longesthist_fractal))
crossover_calc = vortexhist > 0 and vortexhist[1] < 0
crossunder_calc = vortexhist < 0 and vortexhist[1] > 0
crossover2 = crossover(vortexhist, 0)
crossunder2 = crossunder(vortexhist, 0)
hist_color = hist > 0? fuchsia : purple
longhist_color = longhist > 0? olive : orange
longesthist_color = longesthist > 0? teal : blue
vortexhist_color = vortexhist >= 0? green : red
plot(longesthist, "Longest Ocillator", style = histogram, color = longesthist_color, transp = 5)
plot(longhist, "Longer Ocillator", style = histogram, color = longhist_color, transp = 30)
plot(hist, "Short Ocillator", style = histogram, color = hist_color, transp = 30)
plot(vortexhist, "Vortex Ocillator", style = columns, color = vortexhist_color, transp = 40)
plotshape(crossover_calc,title = "Crossover",location = location.bottom, style = shape.triangleup, size = size.small, color = green)
plotshape(crossunder_calc,title = "Crossunder",location = location.bottom, style = shape.triangledown, size = size.small, color = red)
//micro
micro_ema_length = input(6,"Micro EMA Length")
micro = ema(vortexhist, micro_ema_length)
plot(micro, title = "micro", linewidth = 1, color = white)
microup = crossover(vortexhist, micro)
microdown = crossunder(vortexhist, micro)
//new micro signals
xmicroup = microup and vortexhist >=0 or crossover_calc
xmicrodown = microdown and vortexhist >=0 or crossunder_calc
plotshape(xmicroup, title = "Micro up", style = shape.circle, color = olive, location = location.bottom, size = size.tiny)
plotshape(xmicrodown, title = "Micro down", style = shape.circle, color = fuchsia, location = location.bottom, size = size.tiny)
//optional strategy options for backtesting, comment out the alertcondition rows and swap the top study row for the strategy row to compile as strategy
if testPeriod()
strategy.entry("buy", true, 1, when = xmicroup, limit = low)
if testPeriod()
strategy.close("buy", when = xmicrodown)
//if (xmicroup)
//strategy.entry("My Long Entry Id", strategy.long)
//if (xmicroup)
//strategy.exit("My Short Exit Id", "My Short Entry Id")
//if (xmicrodown)
//strategy.exit("My Long Exit Id", "My Long Entry Id")