가격 채널 돌파를 기반으로 한 Donchian의 양적 거래 전략

1
Follow
1778
Followers
개요
이 전략의 핵심 아이디어는 돈치안 통로의 가격 돌파 상황에 따라 거래하는 것으로, 트렌드 추적 유형에 속한다. 그것은 가격 통로를 자동으로 식별하고, 가격 돌파구가 통로를 따라 있을 때 포지션을 열고, 가격이 통로 아래로 돌아와서 근처에 있거나 손해 막점으로 떨어질 때 평지 포지션을 한다. 이 전략은 중간 긴 선의 가격 트렌드를 포착하기 위해 고안되었으며, 주식 지수와 같은 금융 파생 상품의 알고리즘 거래에 적용된다.
원칙
이 전략은 돈치안 통로 지표에 기초하고 있으며, 돈치안 통로는 주어진 주기 동안의 최고 가격과 최저 가격으로 그려진 통로 영역입니다. 계산 방법은 다음과 같습니다:
오프 레일 = 근 n 사이클의 최고 가격
하위 궤도 = 근 n주기의 최저 가격
가격이 경로를 돌파할 때 다단 트렌드에 들어간다고 간주하고, 가격이 경로를 돌파할 때 공중 트렌드에 들어간다고 간주한다. 이 전략은 경로를 돌파하는 경우에만 고려한다.
거래 논리는 다음과 같습니다.
- n주기 최고값을 사용하여 동천 통로 선로를 그리기
- 종결가격이 상승할 때 더 많이 입점하세요.
- 정지 방식은 종결 가격으로 통로 하계 레일 근처 또는 설정된 정지점으로 돌아갑니다.
장점
이 전략은 다음과 같은 장점을 가지고 있습니다.
- 전략은 명확하고 이해하기 쉽고 실행이 가능합니다.
- 동천 통로 지표는 성숙하고 신뢰할 수 있으며 트렌드 방향을 쉽게 판단할 수 있습니다.
- "인공의 힘에 의해, 우리는 모든 것을 통제할 수 있습니다.
- 구성 가능한 매개 변수, 적응력
- 손실을 제한할 수 있는 스포드 메커니즘을 포함하고 있습니다.
위험
이 전략에는 몇 가지 위험도 있습니다.
- 둥<unk> 통로에서 부득이하게 손실이 발생할 수 있다.
- 부적절한 스톱 포지션 설정으로 손실이 커질 수 있습니다.
- 통로에 접근할 때 주의해야 할 역전 위험
- 매개 변수 설정 ((주기 길이 등) 이 적절하지 않으면 정책 효과에 영향을 미칩니다.
대응방법:
- 다른 지표와 함께 필터링 평준화
- 정지 위치를 최적화하고, 부드러운 탈퇴
- 통로 근처의 거래량을 늘리거나, 정지 범위를 확대하는 것을 고려하십시오.
- 다양한 변수를 테스트하여 최적의 변수를 찾습니다.
최적화 방향
이 전략은 다음과 같은 부분에서 최적화될 수 있습니다.
- MACD, KD 등과 같은 다른 지표 판단을 추가하여 평형 파열을 피하십시오.
- 가격 변동에 따른 이동식 손해제도와 같은 손해제도 최적화
- 참여 통제를 최적화하여, 예를 들어 변동성이 커질 때만 거래하는 방법
- 변수 최적화, 최적의 변수 조합을 찾는 것
요약하다
이 전략은 전체적인 아이디어가 명확하고 이해하기 쉽고 구현되며, 성숙한 돈치안 통로 지표를 사용하여 트렌드 방향을 자동으로 식별한다. 동시에 구성은 유연하며, 실제 필요에 따라 조정할 수 있다.
Source
Pine
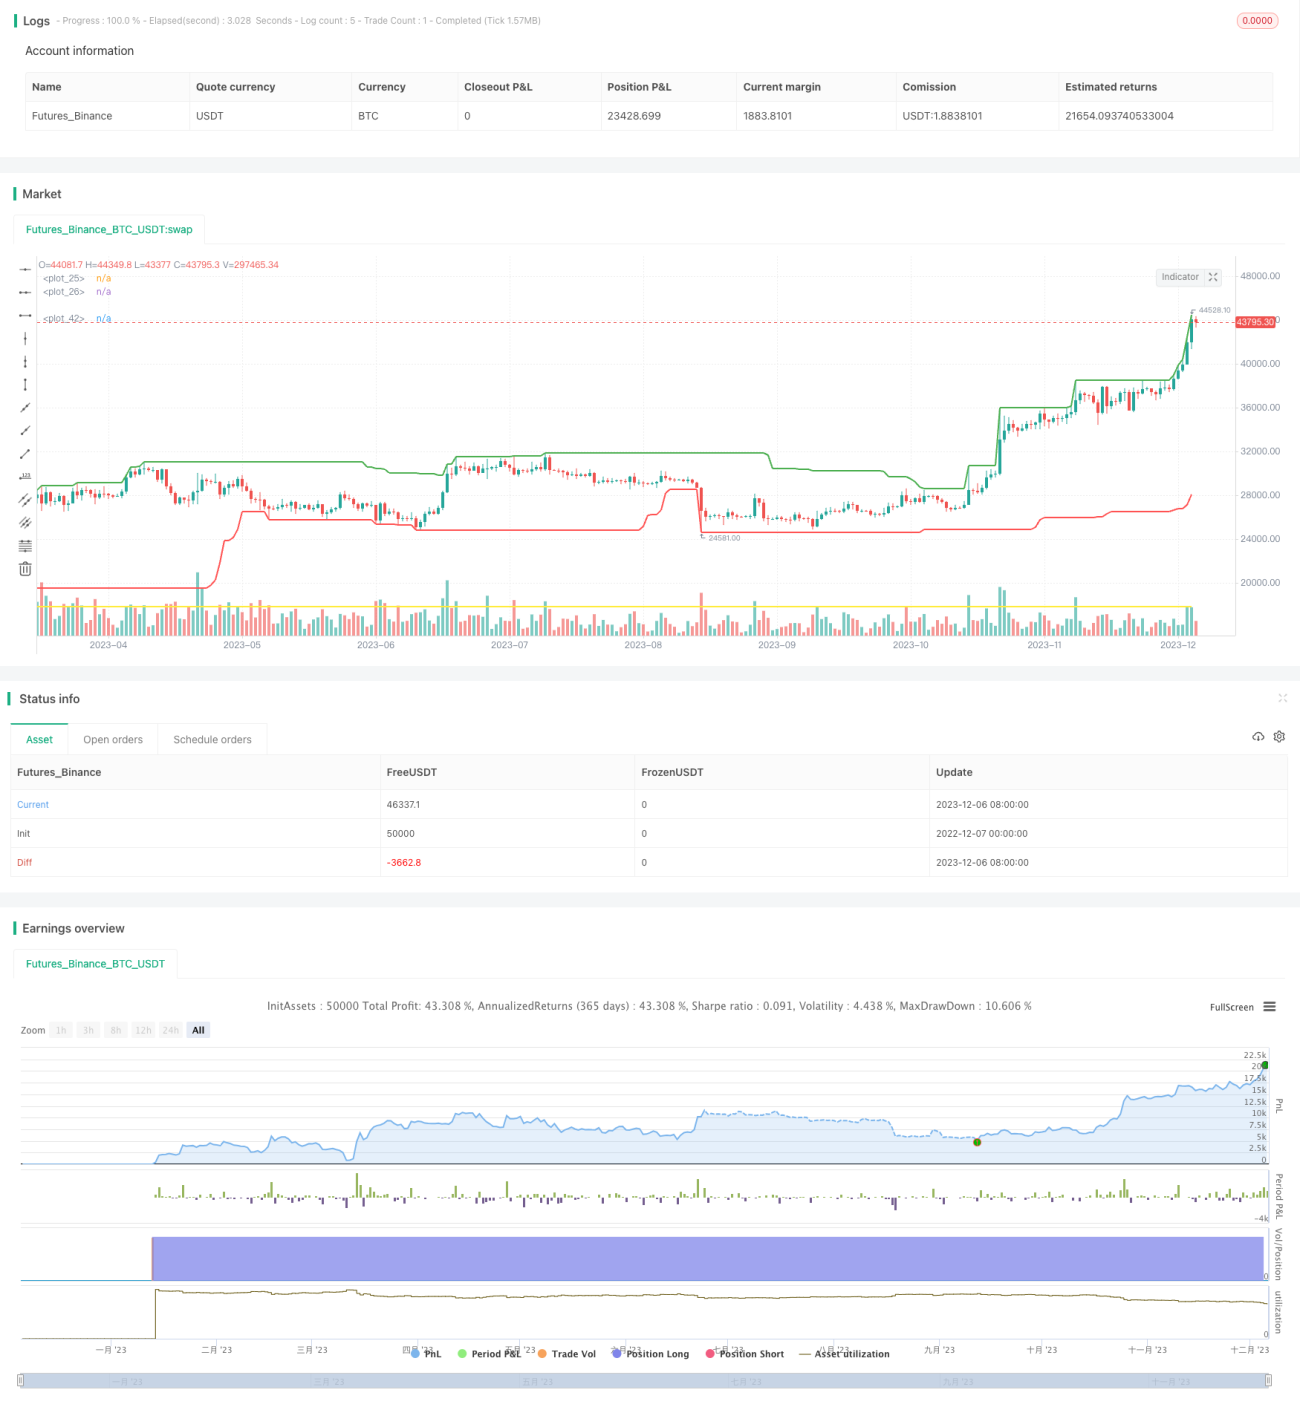
/*backtest
start: 2022-12-07 00:00:00
end: 2023-12-07 00:00:00
period: 1d
basePeriod: 1h
exchanges: [{"eid":"Futures_Binance","currency":"BTC_USDT"}]
*/

// This source code is subject to the terms of the Mozilla Public License 2.0 at https://mozilla.org/MPL/2.0/
// © Giovanni_Trombetta

// Strategy to capture price channel breakoutsStrategy parameters
Related strategies
Comment
All comments (0)
No data
- 1