이동평균 돌파 볼린저 밴드 전략

1
Follow
1778
Followers
개요
이 전략은 이동 평균 지표, 부린 띠 지표 및 UT Bot Alerts 지표를 결합하여 간단한 돌파구 운영 전략을 구현합니다. 가격이 부린 띠를 돌파 할 때, 더 많이하고, 가격이 부린 띠를 돌파 할 때, 더 많이하지 않습니다.
전략 원칙
- 200주기 EMA를 사용하여 트렌드를 판단하는 중축선. EMA 위쪽의 가격은 호불호가 있고, EMA 아래쪽의 가격은 호불호가 있다.
- UT Bot Alerts 지표는 ATR과 결합하여 매매 신호를 생성한다. 가격과 빠른 EMA 교차 부린이 궤도에 오르면 다중 신호가 발생하며, 가격과 빠른 EMA 교차 부린이 궤도에 오르면 공백 신호가 발생한다.
- ATR 스톱 로드 지표는 스톱 로드 포인트를 설정하는 데 사용됩니다. 스톱 로드 거리는 ATR 값의 1.5배입니다.
- 진입 후 리스크 수익률을 통해 진입 가격에 스톱로스, 스톱스톱, 스톱로스를 이동한다.
우위 분석
- 브린 벨트 지표를 사용하여 더 많은 코카이드를 할 때 적절한 시간을 판단하여 수익률을 높일 수 있습니다.
- UT Bot Alerts 지표는 비교적 정확한 신호를 생성할 수 있다.
- 리스크/이익 비율을 사용하여 손실을 막는 것은 위험을 효과적으로 통제할 수 있다.
위험 분석
- 브린 벨트는 흔들리는 도시에서 잘못된 신호를 유발할 수 있습니다.
- ATR은 지연성이 있으며, 트렌드 초기에 막힘이 너무 커질 수 있다.
- 위험과 이익의 비율을 잘못 설정하면 너무 급진적이거나 너무 보수적이 될 수 있습니다.
최적화 방향
- 다른 지표들을 사용해서 UT Bot Alerts 지표를 대체할 수 있습니다.
- ATR의 주기 및 배수를 최적화하여 스톱더스 거리를 더 적절하게 만들 수 있다.
- 다양한 리스크/이익 비율을 테스트하여 최적의 변수를 찾을 수 있다.
요약하다
이 전략은 여러 지표의 장점을 통합하여 강력한 실용성을 갖는다. 매개 변수를 최적화하면 안정적이고 신뢰할 수 있는 돌파구 시스템이 될 수 있다. 그러나 또한 지표의 실패와 매개 변수가 부적절하게 발생하는 위험을 예방하는 데 주의를 기울여야 한다.
Source
Pine
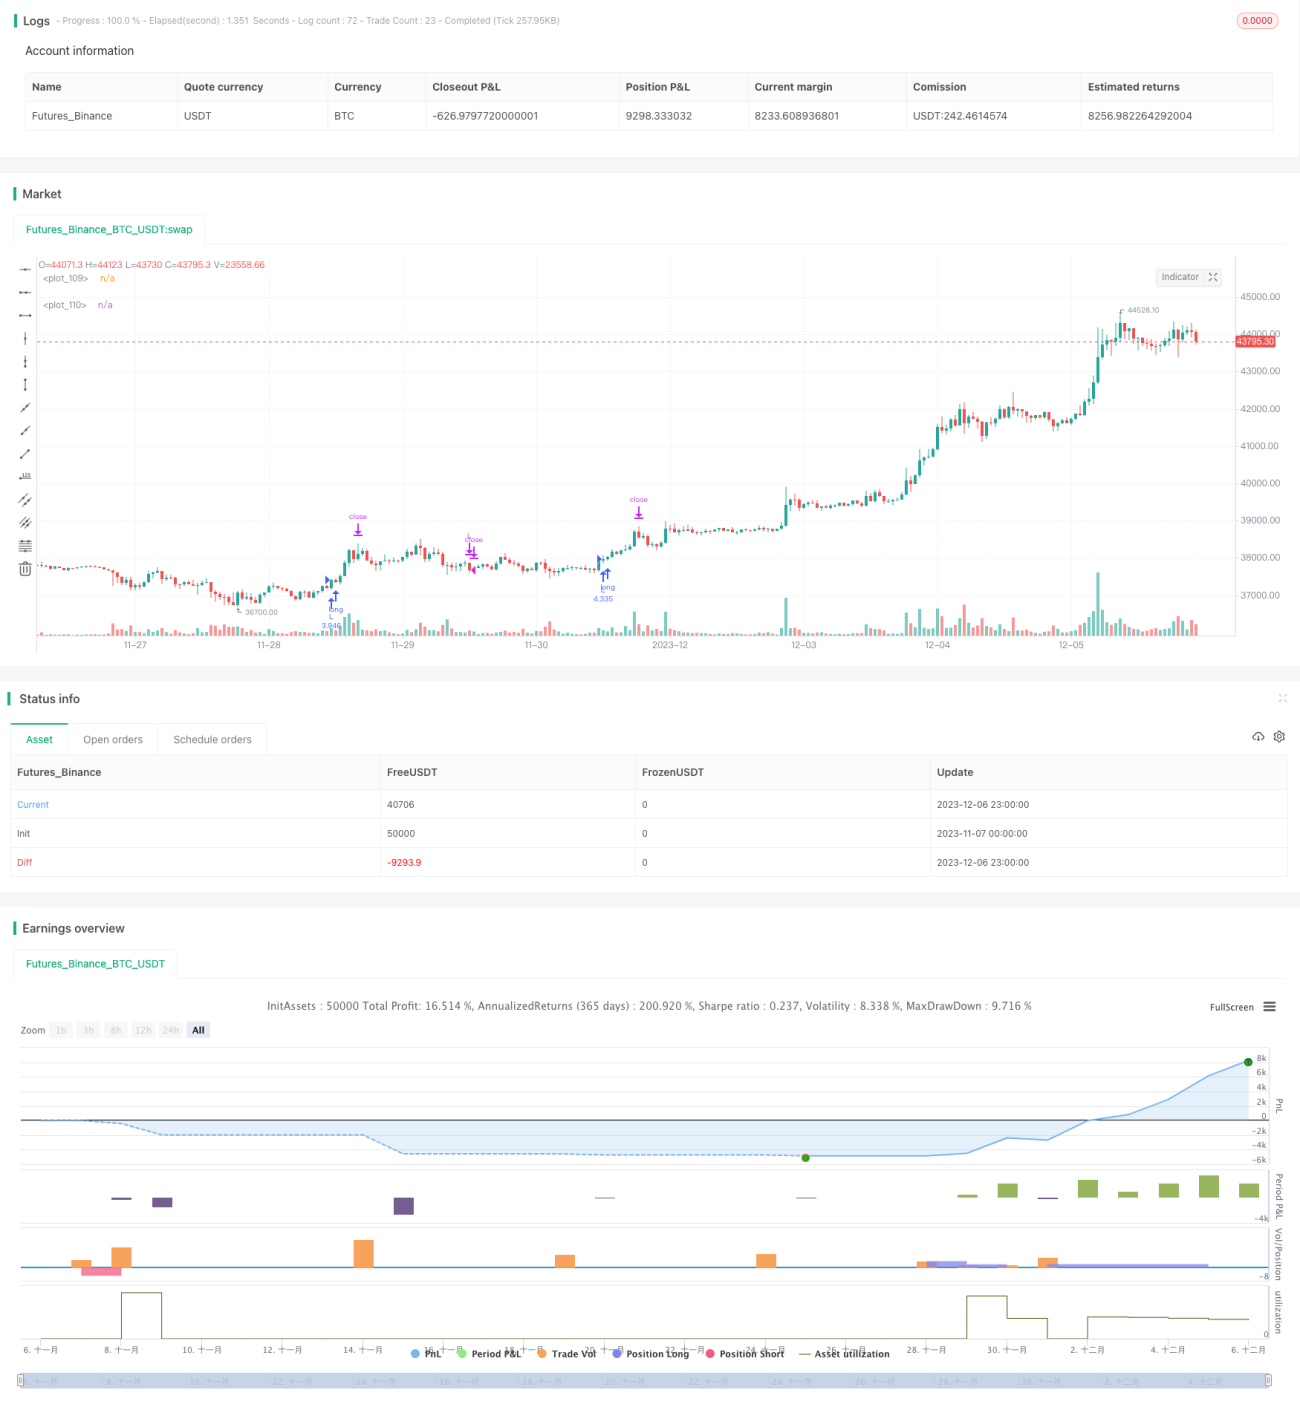
/*backtest
start: 2023-11-07 00:00:00
end: 2023-12-07 00:00:00
period: 1h
basePeriod: 15m
exchanges: [{"eid":"Futures_Binance","currency":"BTC_USDT"}]
*/

// This source code is subject to the terms of the Mozilla Public License 2.0 at https://mozilla.org/MPL/2.0/
//@version=5
//Developed by StrategiesForEveryone
Strategy parameters
Related strategies
Comment
All comments (0)
No data
- 1