이동평균 골든크로스와 데드크로스 추세추적 전략

1
Follow
1778
Followers
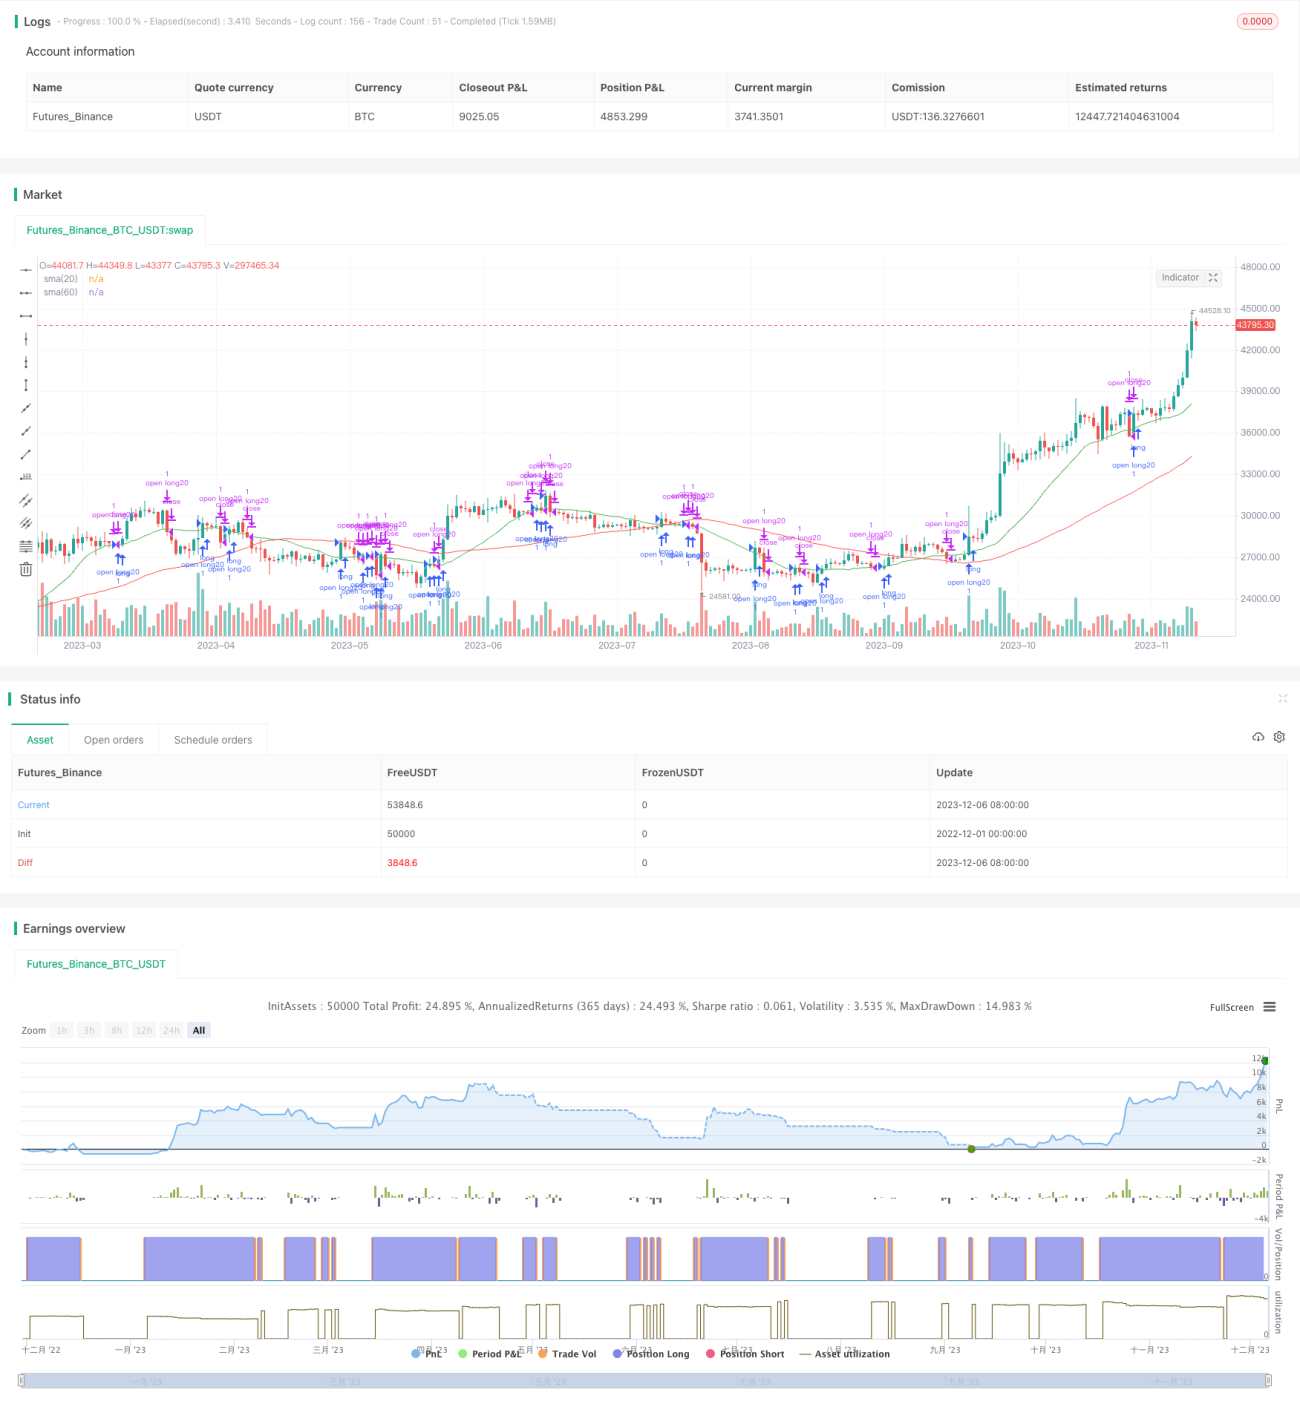
이 전략은 20 일선과 60 일선의 이동 평균을 교차하여 매매 신호를 형성한다. 가격이 상승하면 20 일선을 돌파하면 더 많이 하고, 가격이 하락하면 20 일선을 돌파하면 평소한다. 마찬가지로, 가격이 60 일선을 돌파하면 매매 신호를 형성한다. 이 전략은 전형적인 트렌드 추적 전략이다.
전략 원칙
- 20일 간소 이동 평균과 60일 간소 이동 평균을 계산합니다.
- 20일 경계를 넘으면 더 많은 것을 해야 한다
- 마감가격이 20일 선을 넘을 때 평점
- 60일 경계를 넘으면 더 많이 하세요.
- 60일 경계를 넘어서며 하락했을 때 평준화
위와 같은 거래 신호와 규칙은 이 전략을 형성한다. 가격이 평균을 돌파했을 때, 트렌드가 시작되었다는 것을 나타내고, 추세를 더 많이 추적할 수 있다. 가격이 평균을 넘어섰을 때, 트렌드가 끝났다는 것을 나타내고, 이 때 평형이 올바른 선택이다.
전략적 이점
- 이중 이동 평균을 결합하여 전략을 더욱 안정화한다. 20일선은 단기 트렌드 기회를 더 빨리 포착할 수 있다. 60일선은 단기 시장 소음을 필터링하여 중기 장기 트렌드를 잠금시킨다.
- 2018년부터는 대만 주식시장을 선택했는데, 대만 A주, 대만 주식의 거래제도가 더 완벽하고 전략 효과를 더 잘 반영했다.
- 합리적인 스톱로스 및 포지션 컨트롤을 설정하여 리스크를 최대한 제어합니다.
전략적 위험
- 이 전략은 이동 평균 지표에만 기반을 두고 있으며, 시장이 명백한 추세가 없을 때 더 많은 휘어러와 배차가 발생한다.
- 이 전략은 매매량과 포지션을 최적화하지 않고 자금을 최대한 활용할 수 없습니다.
- 이 전략은 가격 상승과 하락에 대칭적으로 반응하여 시장의 다른 상황에 대응할 수 없습니다.
위험 해결 방법:
- KDJ, MACD 등과 같은 다른 지표 조합을 추가할 수 있습니다.
- 시장가치, 변동성 등의 요인에 따라 포지션과 거래자금의 사용 효율을 최적화 할 수 있습니다.
- 대시장 지수의 다른 단계에 따라 비대칭 동작을 적용할 수 있으며, 충격적 조정에서 거래를 줄이고, 명확한 추세에서 포지션을 증가시킨다.
전략 최적화 방향
- 구매/판매 수를 최적화한다. 포지션 수를 스톱로스 정보의 동성에 따라 조정할 수 있다.
- 이동 평균의 일간 변수를 최적화한다. 단계적 최적화, 무작위적 최적화 등의 방법을 사용하여 더 우수한 변수를 찾을 수 있다.
- 더 많은 스톱 전략. 스톱을 이동하거나 스톱을 고정하면 더 나은 이익을 보호 할 수 있습니다.
- 포지션 관리를 늘립니다. 자금 규모와 시장 규모에 따라 단일 거래의 포지션을 동적으로 조정합니다.
요약하다
이 전략은 전체적으로 전형적인 쌍 이동 평균 횡단 전략이다. 핵심 아이디어는 트렌드를 추적하고, 가격이 평균을 돌파할 때 트렌드 위치를 설정한다. 전략은 간단하고 실용적이며, 구현하기 쉽다. 또한, 변수 최적화, 스톱 손실 회피, 포지션 관리 등의 수단으로 더 나은 전략 효과를 얻을 수 있는 몇 가지 최적화 가능한 공간도 있다.
Source
Pine
Strategy parameters
Related strategies
Comment
All comments (0)
No data
- 1