
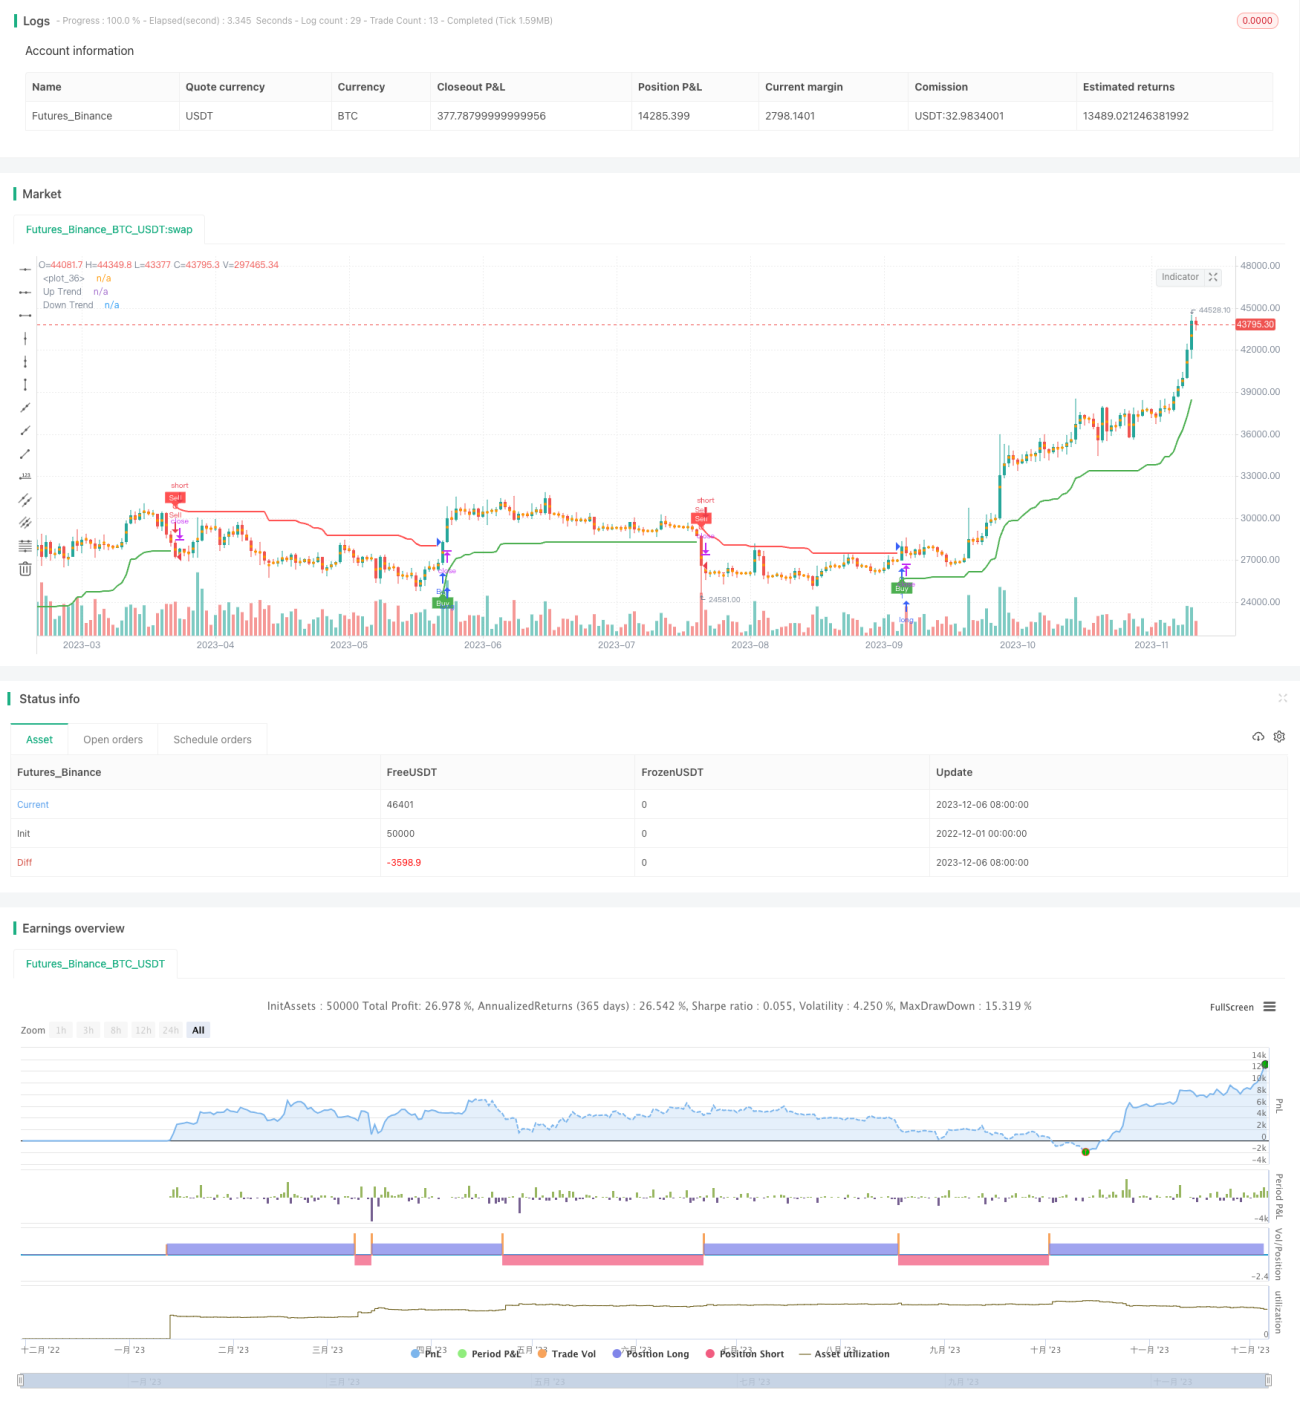
이 전략은 평균 실제 변동 범위 (Average True Range, ATR) 지표에 기초하여 구축된 초 트렌드 라인이며, 시장 추세 방향을 판단하고 거래 신호를 주는 트렌드 추적 전략이다. 이 전략은 동시지수 선물, 외환 및 디지털 통화 등의 분야에서 트렌드 판단과 트렌드 추적의 이중 기능을 동시에 갖는다.
이 전략은 일정 주기 내의 ATR 지표를 계산하여 가격과 비교하여 가격이 상승 트렌드 통로 안에 있는지 판단한다. 구체적으로, 전략은 ATR 지표를 먼저 계산한 다음 ATR 값에 따라 계수를 곱하여 오프트레일과 오프트레일을 구성한다. 가격이 오프트레일보다 높으면 상승 트렌드로 판단하고, 가격이 오프트레일보다 낮으면 하향 트렌드로 판단한다. 상승 트렌드에서 가격이 하향 트렌드에서 상승 트렌드로 전환하면 구매 신호를 발생시키고, 하향 트렌드에서 가격이 상승 트렌드에서 하향 트렌드로 전환하면 판매 신호를 발생시킨다.
이 전략의 핵심은 트렌드를 판단하는 기준을 구축하는 데 있습니다. 트렌드 라인을 초과하는 트렌드 라인은 ATR 지표의 동적 변화에 기반하여 시장 소음을 효과적으로 필터링하여 주요 트렌드 방향을 판단 할 수 있습니다. 동시에, 트렌드 라인은 약간의 지연성을 가지고 있으며, 이는 트렌드 전환점을 확인하고 잘못된 거래 신호를 피하는 데 도움이됩니다.
이 전략의 가장 큰 장점은 트렌드 판단과 트렌드 추적을 결합하는 능력에 있습니다. 구체적으로, 주요 장점은 다음과 같습니다:
이 전략에는 다음과 같은 위험들이 있습니다.
방책 측면에서, ATR 주기, 초 트렌드 라인 계수 등의 파라미터를 조정하여 최적화 할 수 있으며, 다른 지표와 결합하여 검증하여 잘못된 신호의 가능성을 줄일 수 있습니다. 또한, 중지 손실을 설정하여 단편 손실을 제어 할 수 있습니다.
이 전략에는 더 많은 최적화 가능성이 있습니다:
깊이 있는 최적화를 통해 전략의 안정성, 적응성 및 수익성 공간을 더욱 높일 수 있습니다.
이 전략은 전체적으로 안정적이고, 신뢰할 수 있고, 수익이 좋은 특징을 가지고 있다. 트렌드 라인을 넘어 주요 트렌드를 판단하는 것과 동시에 거래 신호를 주는 것이 전략의 가장 큰 장점이다. 그러나 또한 어느 정도의 지연성과 잘못된 판단의 위험이 있다. 매개 변수 및 모델 최적화를 통해 더 나은 전략 성능을 얻을 수 있다.
/*backtest
start: 2022-12-01 00:00:00
end: 2023-12-07 00:00:00
period: 1d
basePeriod: 1h
exchanges: [{"eid":"Futures_Binance","currency":"BTC_USDT"}]
*/
//@version=4
strategy("Supertrend Strategy", overlay = true)
Periods = input(10, title="ATR Period")
src = input(hl2, title="Source")
Multiplier = input(3.0, title="ATR Multiplier", step=0.1)
changeATR = input(true, title="Change ATR Calculation Method?")
showsignals = input(true, title="Show Buy/Sell Signals?")
highlighting = input(true, title="Highlighter On/Off?")
atr2 = sma(tr, Periods)
atr = changeATR ? atr(Periods) : atr2
up = src - (Multiplier * atr)
up1 = nz(up[1], up)
up := close[1] > up1 ? max(up, up1) : up
dn = src + (Multiplier * atr)
dn1 = nz(dn[1], dn)
dn := close[1] < dn1 ? min(dn, dn1) : dn
trend = 1
trend := nz(trend[1], trend)
trend := trend == -1 and close > dn1 ? 1 : trend == 1 and close < up1 ? -1 : trend
upPlot = plot(trend == 1 ? up : na, title="Up Trend", style=plot.style_linebr, linewidth=2, color=color.green)
buySignal = trend == 1 and trend[1] == -1
plotshape(buySignal ? up : na, title="UpTrend Begins", location=location.absolute, style=shape.circle, size=size.tiny, color=color.green, transp=0)
plotshape(buySignal and showsignals ? up : na, title="Buy", text="Buy", location=location.absolute, style=shape.labelup, size=size.tiny, color=color.green, textcolor=color.white, transp=0)
dnPlot = plot(trend == 1 ? na : dn, title="Down Trend", style=plot.style_linebr, linewidth=2, color=color.red)
sellSignal = trend == -1 and trend[1] == 1
plotshape(sellSignal ? dn : na, title="DownTrend Begins", location=location.absolute, style=shape.circle, size=size.tiny, color=color.red, transp=0)
plotshape(sellSignal and showsignals ? dn : na, title="Sell", text="Sell", location=location.absolute, style=shape.labeldown, size=size.tiny, color=color.red, textcolor=color.white, transp=0)
mPlot = plot(ohlc4, title="", style=plot.style_circles, linewidth=0)
longFillColor = highlighting ? (trend == 1 ? color.green : color.white) : color.white
shortFillColor = highlighting ? (trend == -1 ? color.red : color.white) : color.white
fill(mPlot, upPlot, title="UpTrend Highlighter", color=longFillColor)
fill(mPlot, dnPlot, title="DownTrend Highlighter", color=shortFillColor)
strategy.entry("Buy", strategy.long, when=buySignal)
strategy.entry("Sell", strategy.short, when=sellSignal)
alertcondition(buySignal, title="SuperTrend Buy", message="SuperTrend Buy!")
alertcondition(sellSignal, title="SuperTrend Sell", message="SuperTrend Sell!")
changeCond = trend != trend[1]
alertcondition(changeCond, title="SuperTrend Direction Change", message="SuperTrend has changed direction!")