다중 요인 적응 모멘텀 추적 전략

개요
다인자 자기 적응 동력 추적 전략은 여러 기술 지표의 통합을 통해 시장 추세와 핵심 지원 저항 지점을 식별하여 암호화폐와 같은 고 변동성 자산에 대한 자동 거래를 구현합니다. 이 전략은 RSI, MACD, Stochastic과 같은 지표를 종합적으로 사용하여 구매 시기를 판단하며 가격 변화의 비율과 결합하여 더 정확한 형태를 식별합니다.
전략 원칙
다인자 자기 적응 동량 추적 전략의 핵심은 여러 가지 기술 지표의 통합 사용에 있다. 이 전략은 주로 다음과 같은 몇 가지 구성 요소를 사용합니다:
-
RSI 지표는 과매매를 판단한다. 다른 파라미터와 결합하여 일반 RSI 신호 또는 개량된 코너 RSI 신호를 식별하여 반전 기회가 있는지 판단 할 수 있다.
-
MACD 지표는 트렌드 방향을 판단하는데 도움을 줍니다. MACD가 신호선을 넘거나 넘을 때 구매 및 판매 신호를 생성합니다.
-
스토카스틱 지표는 오버 바이 오버 셀 영역을 식별한다. K선과 D선의 골드 포크 데드 포크 조합 신호가 반전되는지 판단한다.
-
가격 변화 비율은 진정한 돌파가 있는지 검사한다. 특정 주기 동안의 최고 가격, 최저 가격, 종결 가격 등의 변화 비율을 계산하여 진정한 돌파가 있는지 판단한다.
-
EMA 지표는 큰 레벨의 상공을 판단한다. 빠른 선에서 느린 선을 가로질러 보이스 신호를 주고, 아래로 가로질러 보이스 신호를 준다.
이 전략은 시장의 빈 상태에 따라 더 많은 코카이드를 선택하고 입위 후 스톱로스 스톱을 설정하여 위험을 효과적으로 제어한다. 반전 신호가 발생했을 때 평지 포지션을 선택하여 퇴출한다. 전체 의사 결정 과정은 여러 요소의 판단을 충분히 결합하여 더 정확한 판단을 가능하게 한다.
우위 분석
이 전략에는 다음과 같은 장점이 있습니다.
-
다중 인자 드라이브는 판단의 장점을 가지고 있다. 단일 지표에 비해, 다중 지표 조합은 서로를 검증할 수 있어 결과를 더 정확하고 신뢰할 수 있어 불필요한 거래 비용을 절감한다.
-
조건은 엄격하게 잘못된 거래를 피한다. 전략은 구매 및 판매 조건에 대한 엄격한 요구 사항을 설정하고, 여러 지표가 동시에 신호를 방출해야 함으로써 많은 소음을 필터링하여 잘못된 거래가 발생하지 않도록합니다.
-
자기 적응 초변수 (自适应超参数) 는 인적 개입을 줄인다. 정책의 내장 동적으로 지표 변수를 계산하는 능력, 인적 선택 초변수 (超参数) 의 주관성을 피하고, 따라서 정책의 파라미터 (Parameters) 를 더 과학적으로 객관적으로 만든다.
-
스톱로스<unk> 메커니즘 제어 위험. 전략은 포지션을 개시한 후 실시간으로 계산하고 스톱로스<unk> 위치를 매핑하여 단일 손실을 효과적으로 제어하고 포지션 폭파의 발생을 방지할 수 있다.
위험 분석
이 전략에는 몇 가지 위험도 있습니다.
-
지표 오류가 신호를 방출할 확률. 다중 지표 검증은 오류의 비율을 크게 줄일 수 있지만, 여전히 발생할 가능성이 있다. 이것은 불필요한 손실을 초래할 수 있다.
-
막힘이 뚫릴 위험이 있다. 극단적인 상황에서는 가격이 급격히 떨어질 수 있으며, 원래의 막힘이 쉽게 뚫려 큰 손실을 초래한다.
-
매개 변수 최적화로 인한 과도한 최적화. 동적 매개 변수는 인위적인 선택으로 인한 주관성을 피하지만, 매개 변수의 과도한 최적화로 인해 일반화 능력을 잃게 할 수 있습니다.
대응방법:
- 신호 필터링 조건의 엄격함을 높이고, 잘못된 신호 비율을 줄여라.
- 한 번에 너무 큰 손실을 피하기 위해, 분량으로 창고를 건설하는 방법을 사용하십시오.
- 테스트 샘플 수를 늘리고, 매개 변수 안정성을 엄격히 평가한다.
전략 최적화 방향
다인자 적응 동량 추적 전략에는 다음과 같은 몇 가지 최적화 가능한 차원이 있습니다.
-
판단 요소의 수를 늘리십시오. 변동률, 거래량과 같은 다양한 유형의 지표 신호 판단과 결합하여 보조 판단하십시오.
-
스톱 메커니즘을 최적화하는 알고리즘. 스톱 트래킹, 스톱 진동 등의 더 고급 스톱 알고리즘을 도입하여 스톱이 뚫릴 확률을 더욱 낮출 수 있다.
-
기계 학습 모델을 도입한다. RNN, LSTM 등의 모델을 사용하여 역사적 데이터를 모델링하여 구매 결정에 도움을 준다.
-
전략 통합. 여러 가지 세부 전략을 채택하고, 통합 학습 방법을 사용하여 통합하면 더 안정적인 통합 성과를 얻을 수 있습니다.
요약하다
다인자 자기 적응 동력 추적 전략은 여러 가지 기술 지표를 사용하여 거래 시점을 식별합니다. 단일 지표에 비해 전략 판단은 더 정확하며, 내장 된 매개 변수는 자기 적응 및 스톱 메커니즘이 위험을 제어합니다. 다음 단계는 더 많은 보조 판단 인자, 고급 스톱 알고리즘 및 기계 학습과 같은 방법을 도입하여 전략의 효과를 더욱 강화 할 수 있습니다.
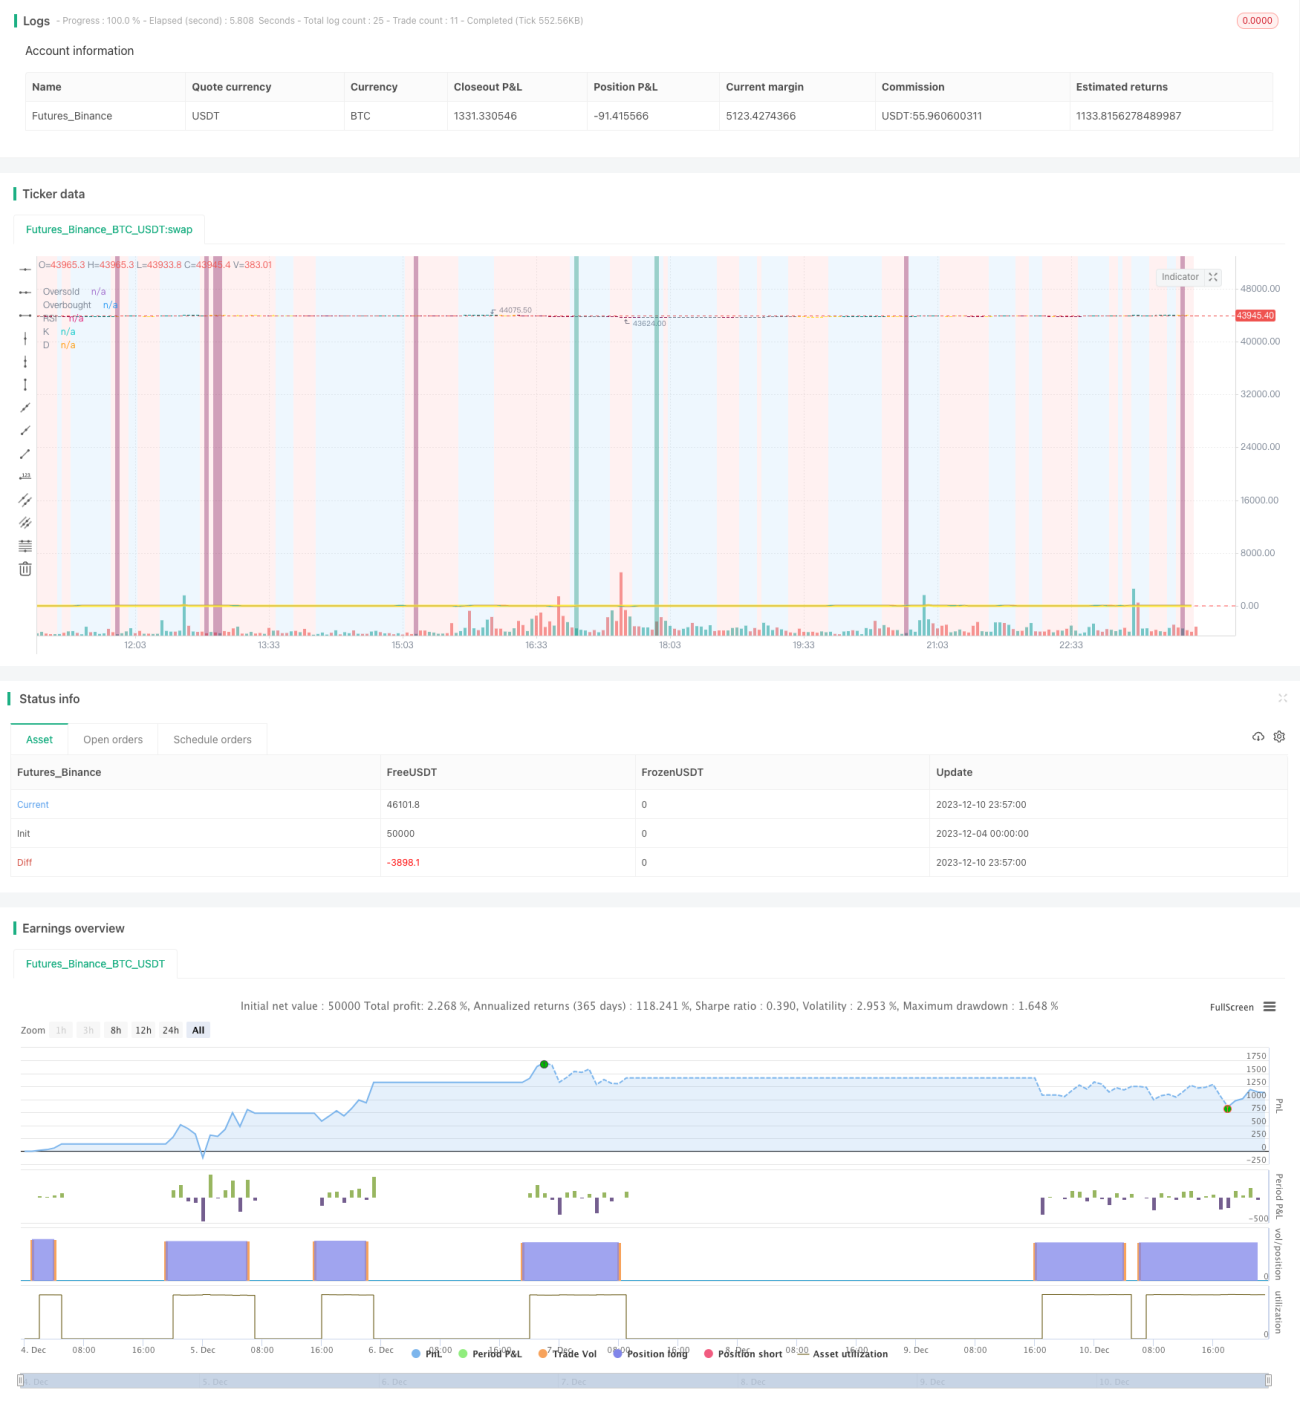
/*backtest
start: 2023-12-04 00:00:00
end: 2023-12-11 00:00:00
period: 3m
basePeriod: 1m
exchanges: [{"eid":"Futures_Binance","currency":"BTC_USDT"}]
*/

// This source code is subject to the terms of the Mozilla Public License 2.0 at https://mozilla.org/MPL/2.0/
//@version=4

// ██████╗██████╗ ███████╗ █████╗ ████████╗███████╗██████╗ ██████╗ ██╗ ██╗ - 1