이동평균선 교차 전략 돌파


생성 날짜: 2023-12-12 17:43:19 마지막으로 수정됨: 2023-12-12 17:43:19
복사: 1 클릭수: 929
avatar of ChaoZhang ChaoZhang
1
집중하다
1621
수행원

이동평균선 교차 전략 돌파

개요

이 전략의 이름은 ‘顺势突破均线交叉策略‘이다. 주요 아이디어는顺势指标과均线交叉을 결합하여 과잉空头 (多空) 을 판단하는 것이다. 구체적으로, 이 전략은 샤프 트렌드 사이클 (Schaff Trend Cycle, STC) 지표와 쌍평균 (双平均) 을 교차한다. STC 방향이 과잉 구매 과잉 판매 영역을 돌파하고, 가격이 단기 지수 이동 평균보다 높고, 단기 지수 이동 평균이 장기 지수 이동 평균보다 높을 때, 과잉空头 (多空头) 을 한다. 반대로,空头 (空头) 을 한다.

전략 원칙

이 전략은 크게 두 가지 기술적인 지표에 기반을 두고 있습니다.

  1. 동향 지표: STC 지표, 트렌드 방향을 판단한다. STS 지표는 MACD 지표, Stoch 지표, STC 지표 라인을 포함한다. STC 라인이 0-25 영역에서 위쪽으로 돌파 할 때 다단계 신호이며, 75-100 영역에서 아래로 돌파 할 때 공허 신호이다.

  2. 평균선 교차: 빠른 간단한 이동 평균 (고전주기 35) 과 느린 간단한 이동 평균 (고전주기 200) 의 교차. 빠른 라인 상에서 느린 라인을 통과하는 것은 다목적 신호이며, 빠른 라인 아래에서 느린 라인을 통과하는 것은 공백 신호이다.

이 전략의 거래 신호 판단 논리는 다음과 같습니다.

  1. 더 많은 신호: STC 지표가 상향으로 25 라인을 돌파하고 빠른 간단한 이동 평균이 느린 간단한 이동 평균보다 높고 가격이 빠른 간단한 이동 평균보다 높을 때 더 많이하십시오.

  2. 공백 신호: STC 지표가 75선을 아래로 돌파하고 빠른 간단한 이동 평균이 느린 간단한 이동 평균보다 낮고 가격이 빠른 간단한 이동 평균보다 낮으면 공백한다.

우위 분석

이 전략은 다음과 같은 장점을 가지고 있습니다.

  1. 트렌드 지표와 평균선 지표가 결합되면 거래 신호가 더 신뢰할 수 있다. STC 지표는 큰 트렌드 방향을 판단하고, 쌍평준은 특정 입장을 판단한다.

  2. 평균선 매개 변수는 조정할 수 있다. 시장에 따라 평균선 매개 변수는 조정할 수 있고, 최적화 전략도 가능하다.

  3. 위험 조절가능하다. STC 지표는 과매도 영역을 판단하고, 극한 영역에서 상위 하위값을 추적하는 것을 피한다. 목표 중지 손실은 400 점의 중지 중지 범위가 설정되어 있다.

위험 분석

이 전략에는 위험도 있습니다.

  1. STC 지표는 가짜 돌파구가 발생할 수 있다. 가격 주체 판단과 결합해야 한다.

  2. 평균선 교차는 더 많은 가짜 신호를 생성할 수 있다. 평균선 주기 변수를 조정할 필요가 있다.

  3. 단방향 거래만 하세요. 공간은 제한되어 있습니다. 양방향 거래도 고려할 수 있습니다.

  4. 외환보증거래를 처리하지 않은 외환보증거래의 슬라이드 리스크. 실장에서의 슬라이드 리스크는 더 클 수 있다.

최적화 방향

이 전략은 다음과 같은 부분에서 최적화될 수 있습니다.

  1. STC 파라미터를 조정하여 과매매 판단을 최적화하십시오.

  2. 평균선 주기를 최적화하고 교차 신호의 신뢰성을 높인다.

  3. 다른 필터링 지표를 추가하여 가짜 돌파구를 필터링합니다. 예를 들어, 브린 밴드입니다.

  4. 2방향 거래 논리를 추가한다. 공간 위험을 줄인다.

  5. 단편적 손실을 제어한다.

요약하다

이 전략은 종합적으로 동향 지표와 평선 교차 지표를 사용하여 트렌드 방향을 판단하고 특정 진입 지점을 결정한다. 특정 위험 제어 조건을 보장하면 더 나은 수익을 얻을 수 있다. 전략 모델은 간단하고 명확하고 이해하기 쉽고, 또한 다양한 시장에 따라 변수를 조정하고 기능을 최적화하기 쉽고, 초보자 학습과 응용에 적합하다.
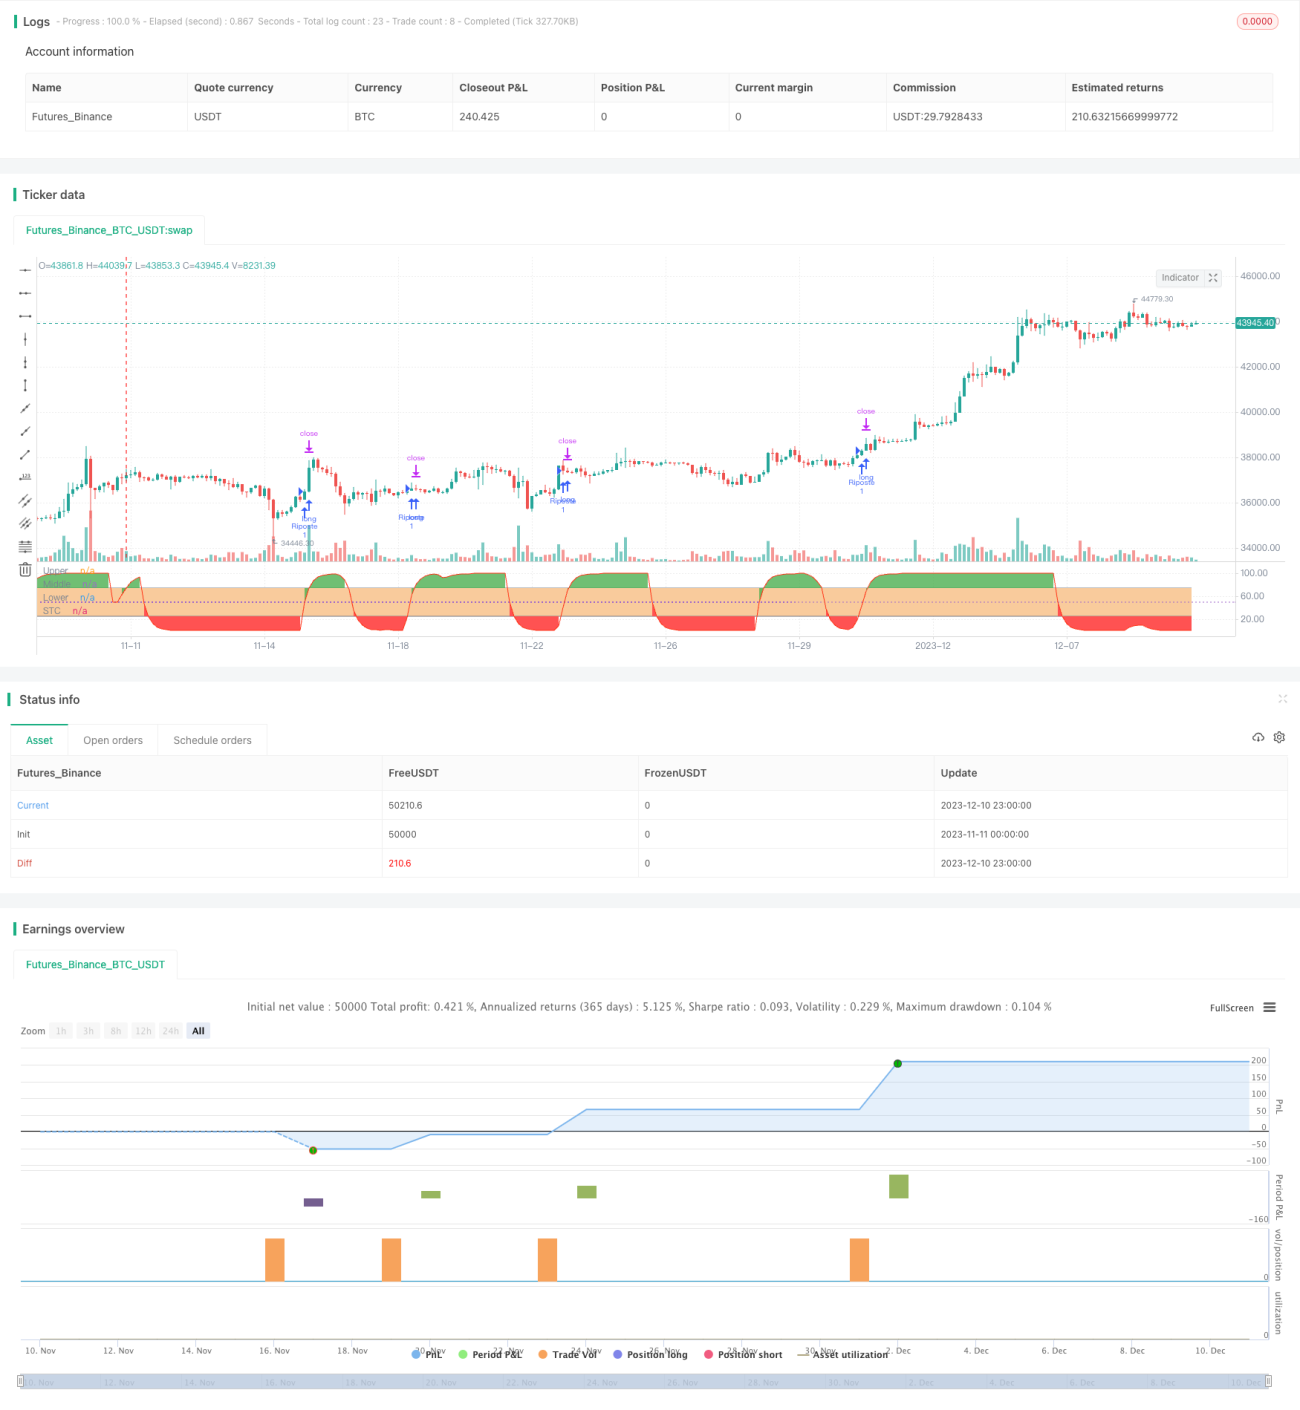
전략 소스 코드
/*backtest
start: 2023-11-11 00:00:00
end: 2023-12-11 00:00:00
period: 3h
basePeriod: 15m
exchanges: [{"eid":"Futures_Binance","currency":"BTC_USDT"}]
*/

//@version=4
// Shaff Trend Cycle coded by Alex Orekhov (everget)
// Strategy and its additional conditions provided by greenmask
// Schaff Trend Cycle script may be freely distributed under the MIT license.
strategy("STC", shorttitle="STC")

fastLength = input(title="MACD Fast Length", type=input.integer, defval=23)
slowLength = input(title="MACD Slow Length", type=input.integer, defval=50)
cycleLength = input(title="Cycle Length", type=input.integer, defval=10)
d1Length = input(title="1st %D Length", type=input.integer, defval=3)
d2Length = input(title="2nd %D Length", type=input.integer, defval=3)
src = close
highlightBreakouts = input(title="Highlight Breakouts ?", type=input.bool, defval=true)

macd = ema(src, fastLength) - ema(src, slowLength)
k = nz(fixnan(stoch(macd, macd, macd, cycleLength)))
d = ema(k, d1Length)
kd = nz(fixnan(stoch(d, d, d, cycleLength)))
stc = ema(kd, d2Length)
stc := 	stc > 100 ? 100 : stc < 0 ? 0 : stc
stcColor = not highlightBreakouts ? (stc > stc[1] ? color.green : color.red) : #ff3013
stcPlot = plot(stc, title="STC", color=stcColor, transp=0)
upper = 75
lower = 25
transparent = color.new(color.white, 100)
upperLevel = plot(upper, title="Upper", color=color.gray)
hline(50, title="Middle", linestyle=hline.style_dotted)
lowerLevel = plot(lower, title="Lower", color=color.gray)

fill(upperLevel, lowerLevel, color=#f9cb9c, transp=90)

upperFillColor = stc > upper and highlightBreakouts ? color.green : transparent
lowerFillColor = stc < lower and highlightBreakouts ? color.red : transparent

fill(upperLevel, stcPlot, color=upperFillColor, transp=80)
fill(lowerLevel, stcPlot, color=lowerFillColor, transp=80)
strategy.initial_capital = 50000
ordersize=floor(strategy.initial_capital/close)
targetvalue = input(title="Target/stop", type=input.integer, defval=400)

ma1length = input(title="SMA1", type=input.integer, defval=35)
ma2length = input(title="SMA2", type=input.integer, defval=200)
ma1 = ema(close,ma1length)
ma2 = ema(close,ma2length)

bullbuy = crossover(stc, lower) and ma1>ma2 and close>ma1
bearsell = crossunder(stc, upper) and ma1<ma2 and close<ma1

if (bullbuy)
    strategy.entry("Riposte", strategy.long, ordersize)
    strategy.exit( "Riposte close", from_entry="Riposte", qty_percent=100, profit=targetvalue,loss=targetvalue)

if (bearsell)
    strategy.entry("Riposte", strategy.short, ordersize)
    strategy.exit( "Riposte close", from_entry="Riposte", qty_percent=100, profit=targetvalue,loss=targetvalue)

//plotshape(bullbuy,  title= "Purple", location=location.belowbar, color=#006600, transp=0, style=shape.circle, size=size.tiny, text="Riposte")
//plotshape(bearsell,  title= "Purple", location=location.abovebar, color=#006600, transp=0, style=shape.circle, size=size.tiny, text="Riposte")