Dow 이론을 기반으로 한 RSI/MFI 모멘텀 지표 전략

1
Follow
1778
Followers
개요
이 전략은 상대적으로 강하고 약한 지표 ((RSI) 또는 자본 흐름 지표 ((MFI) 를 사용하여 시장의 불 또는 곰을 판단하고, 다우 이론의 황소 곰 계수를 결합하여 조정된 확률 분포를 계산합니다. 다른 시장 유형에 따라 다른 입출금 논리를 사용합니다.
전략 원칙
- RSI 또는 MFI를 계산하여 시장의 현재 상태를 판단합니다.
- 다우시 이론의 황소와 곰의 계수를 계산하여 현재 가격과 거래량의 상관성을 반영한다
- RSI/MFI 확률 분포를 조정하여 정확한 다공간 분포를 결정합니다.
- 현재 세션Id 및 확률에 따라 입학 여부를 판단합니다.
- 이윤이 철회되거나 시장이 정리될 때 손실을 막습니다.
우위 분석
- 다오스 이론과 결합하여 시장 유형을 더 정확하게 판단할 수 있습니다.
- 수립 요소를 고려하여 맹목적으로 입학하지 마십시오.
- 수익률이 높고 철수율이 낮다.
위험 분석
- 이 문장에는 "이미, 이미, 이미, 이미, 이미, 이미, 이미, 이미, 이미, 이미"가 있습니다.
- 충분한 역사적 자료가 필요합니다.
- 정지 로직은 단순하며, 특수한 상황에 맞게 최적화할 수 없습니다.
최적화 방향
- 더 많은 지표와 함께 판단할 수 있습니다.
- 변동률, 역사 데이터 등에 기반한 보다 엄격한 손해 방지 논리를 추가합니다.
- 더 나은 매개 변수를 확인하는 기계 학습을 시도할 수 있습니다.
요약하다
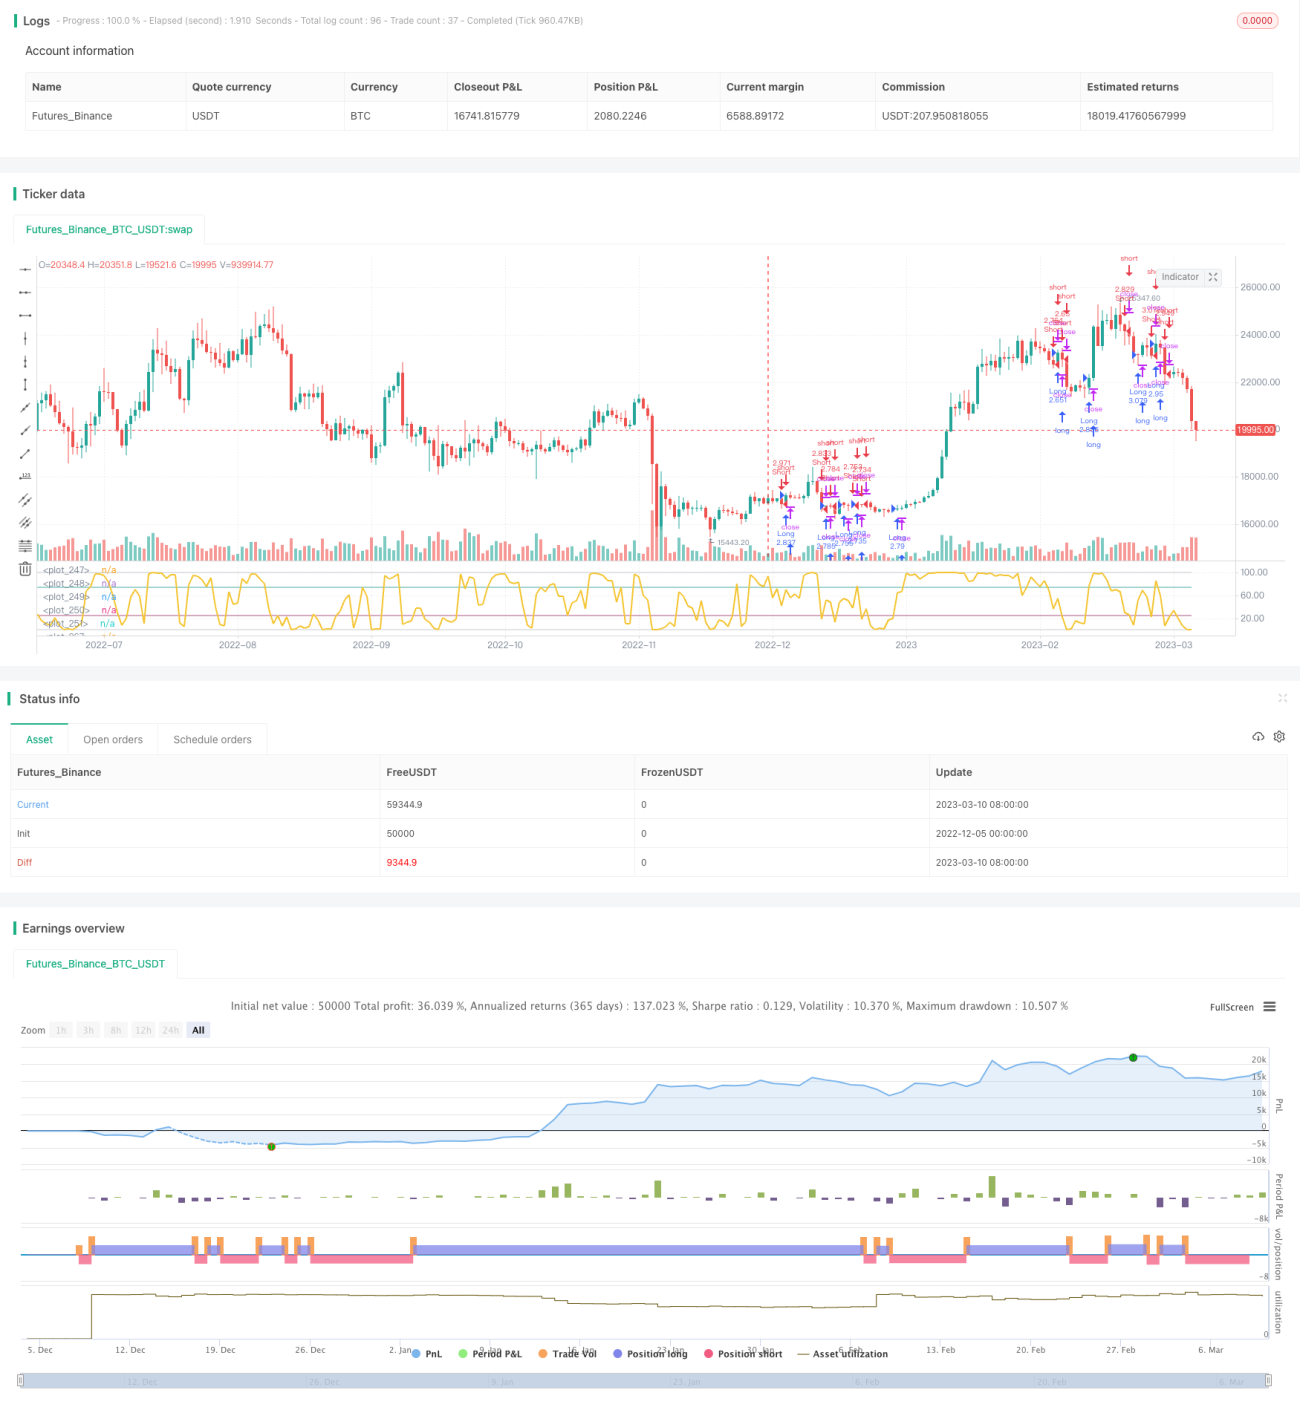
이 전략은 전반적으로 재검사 결과가 좋으며, 실제 전쟁에 대한 가치가 있다. 그러나, 더 많은 테스트와 조정이 필요하며, 특히, 상쇄 논리이다. 보조 판단 지표로 사용하는 효과는 더 좋으며, 맹목적으로 따라서는 안된다.
Source
Pine
Strategy parameters
Related strategies
Comment
All comments (0)
No data
- 1