개요
이 전략은 동적 거래자 지수 (TDI) 지표와 가격 행동 채널 (PAC) 지표에 기반하며, 부린 밴드 채널, 상대적으로 강한 지수 (RSI) 및 MACD 지표와 결합하여 트렌드 추적 시스템을 구현한다.
이 전략은 주로 트렌드를 발견하고 트렌드 방향에 중대한 변화가 있을 때 거래 신호를 생성합니다. 이 전략은 신호의 재생률과 신호 품질을 향상시키기 위해 여러 지표를 결합합니다.
전략 원칙
이 전략의 핵심은 TDI 지표이다. TDI는 여러 개의 하위 지표로 구성되어 있으며, 주로 다음을 포함한다:
- 상대적으로 강한 지수 (RSI): 반응 가격의 강도
- 부린 벨트 통로: 반응 가격 변동 범위
- RSI 가격 선: RSI의 간단한 이동 평균, RSI의 가격 추세에 반응
- RSI 트레이드 신호 라인: RSI의 또 다른 간단한 이동 평균, 트레이드 신호를 생성하기 위한
RSI 가격 라인과 RSI 거래 신호 라인이 황금 을 가로질러 나타나면 구매 신호로; 두 라인이 황금 사망 을 가로질러 나타나면 판매 신호로. 거래 신호 라인이 중선을 가로질러 나타나면 약한 신호를 생성합니다.
또한, 전략은 가격 동작 채널 지표를 결합한다. 이 지표는 시간 주기 내의 최고 가격, 최저 가격을 기반으로 가격 채널을 산출한다. 가격이 채널 상단 또는 하단으로 접근 할 때, 반전 기회가있을 수 있음을 나타냅니다.
잘못된 보고를 필터링하기 위해, 전략은 MACD 지표도 도입했다. MACD 기둥 색이 거래 신호 방향과 일치하는 경우에만 입문 신호를 유발한다.
전략적 이점
이 전략은 단일 지표에 비해 여러 지표의 장점을 통합합니다.
- TDI 지표는 트렌드 변화에 민감합니다.
- 가격 동작 경로는 지지와 압박을 명확하게 나타냅니다.
- MACD는 잘못된 보고를 효과적으로 필터링할 수 있습니다.
또한, 이동 평균과 같은 트렌드 추적 지표에 비해, TDI는 트렌드 반전에 더 민감하며, 불필요한 손실을 줄일 수 있다.
이 전략은 또한 다양한 시장 환경에 적응하기 위해 변수를 조정할 수 있습니다.
전략적 위험
- 다중 지표 중첩, 변수 조정 복잡
- 거래 빈도가 너무 높아서 거래 비용과 점유율 위험이 증가할 수 있습니다.
- 반전 인식은 100% 정확하지 않으며, 한 방향으로 계속되는 가격을 놓칠 수 있습니다.
- 실물 거래의 가격 변동은 재측정보다 훨씬 복잡하고 신호 효과는 복제하기 어렵습니다.
단위 손실을 줄이기 위해 스톱 레저를 확장할 수 있다. 최적화 변수 조합은 신호 품질을 향상시킵니다. 적절한 입시 조건의 완화는 거래 빈도를 감소시킵니다.
최적화 방향
- TDI의 각 변수를 조정하여 최적의 조합을 찾습니다.
- 가격 행동 통로의 길이를 조정하고 지원 저항을 최적화합니다.
- MACD 변수를 조정하여 입시 필터 효과를 최적화합니다.
- 포지션 관리 및 이동 중지 전략을 추가
요약하다
이 전략은 종합적으로 여러 지표를 사용하여 추세와 역전 기회를 판단한다. 다양한 품종에 적응하기 위해 파라미터를 조정할 수 있다. 약간의 실전 가치가 있지만, 신호 효과는 완벽에 가깝지만 여전히 약간의 어려움이 있다. 복잡한 다변화 실盘에서 신중하게 사용하도록 권장한다.
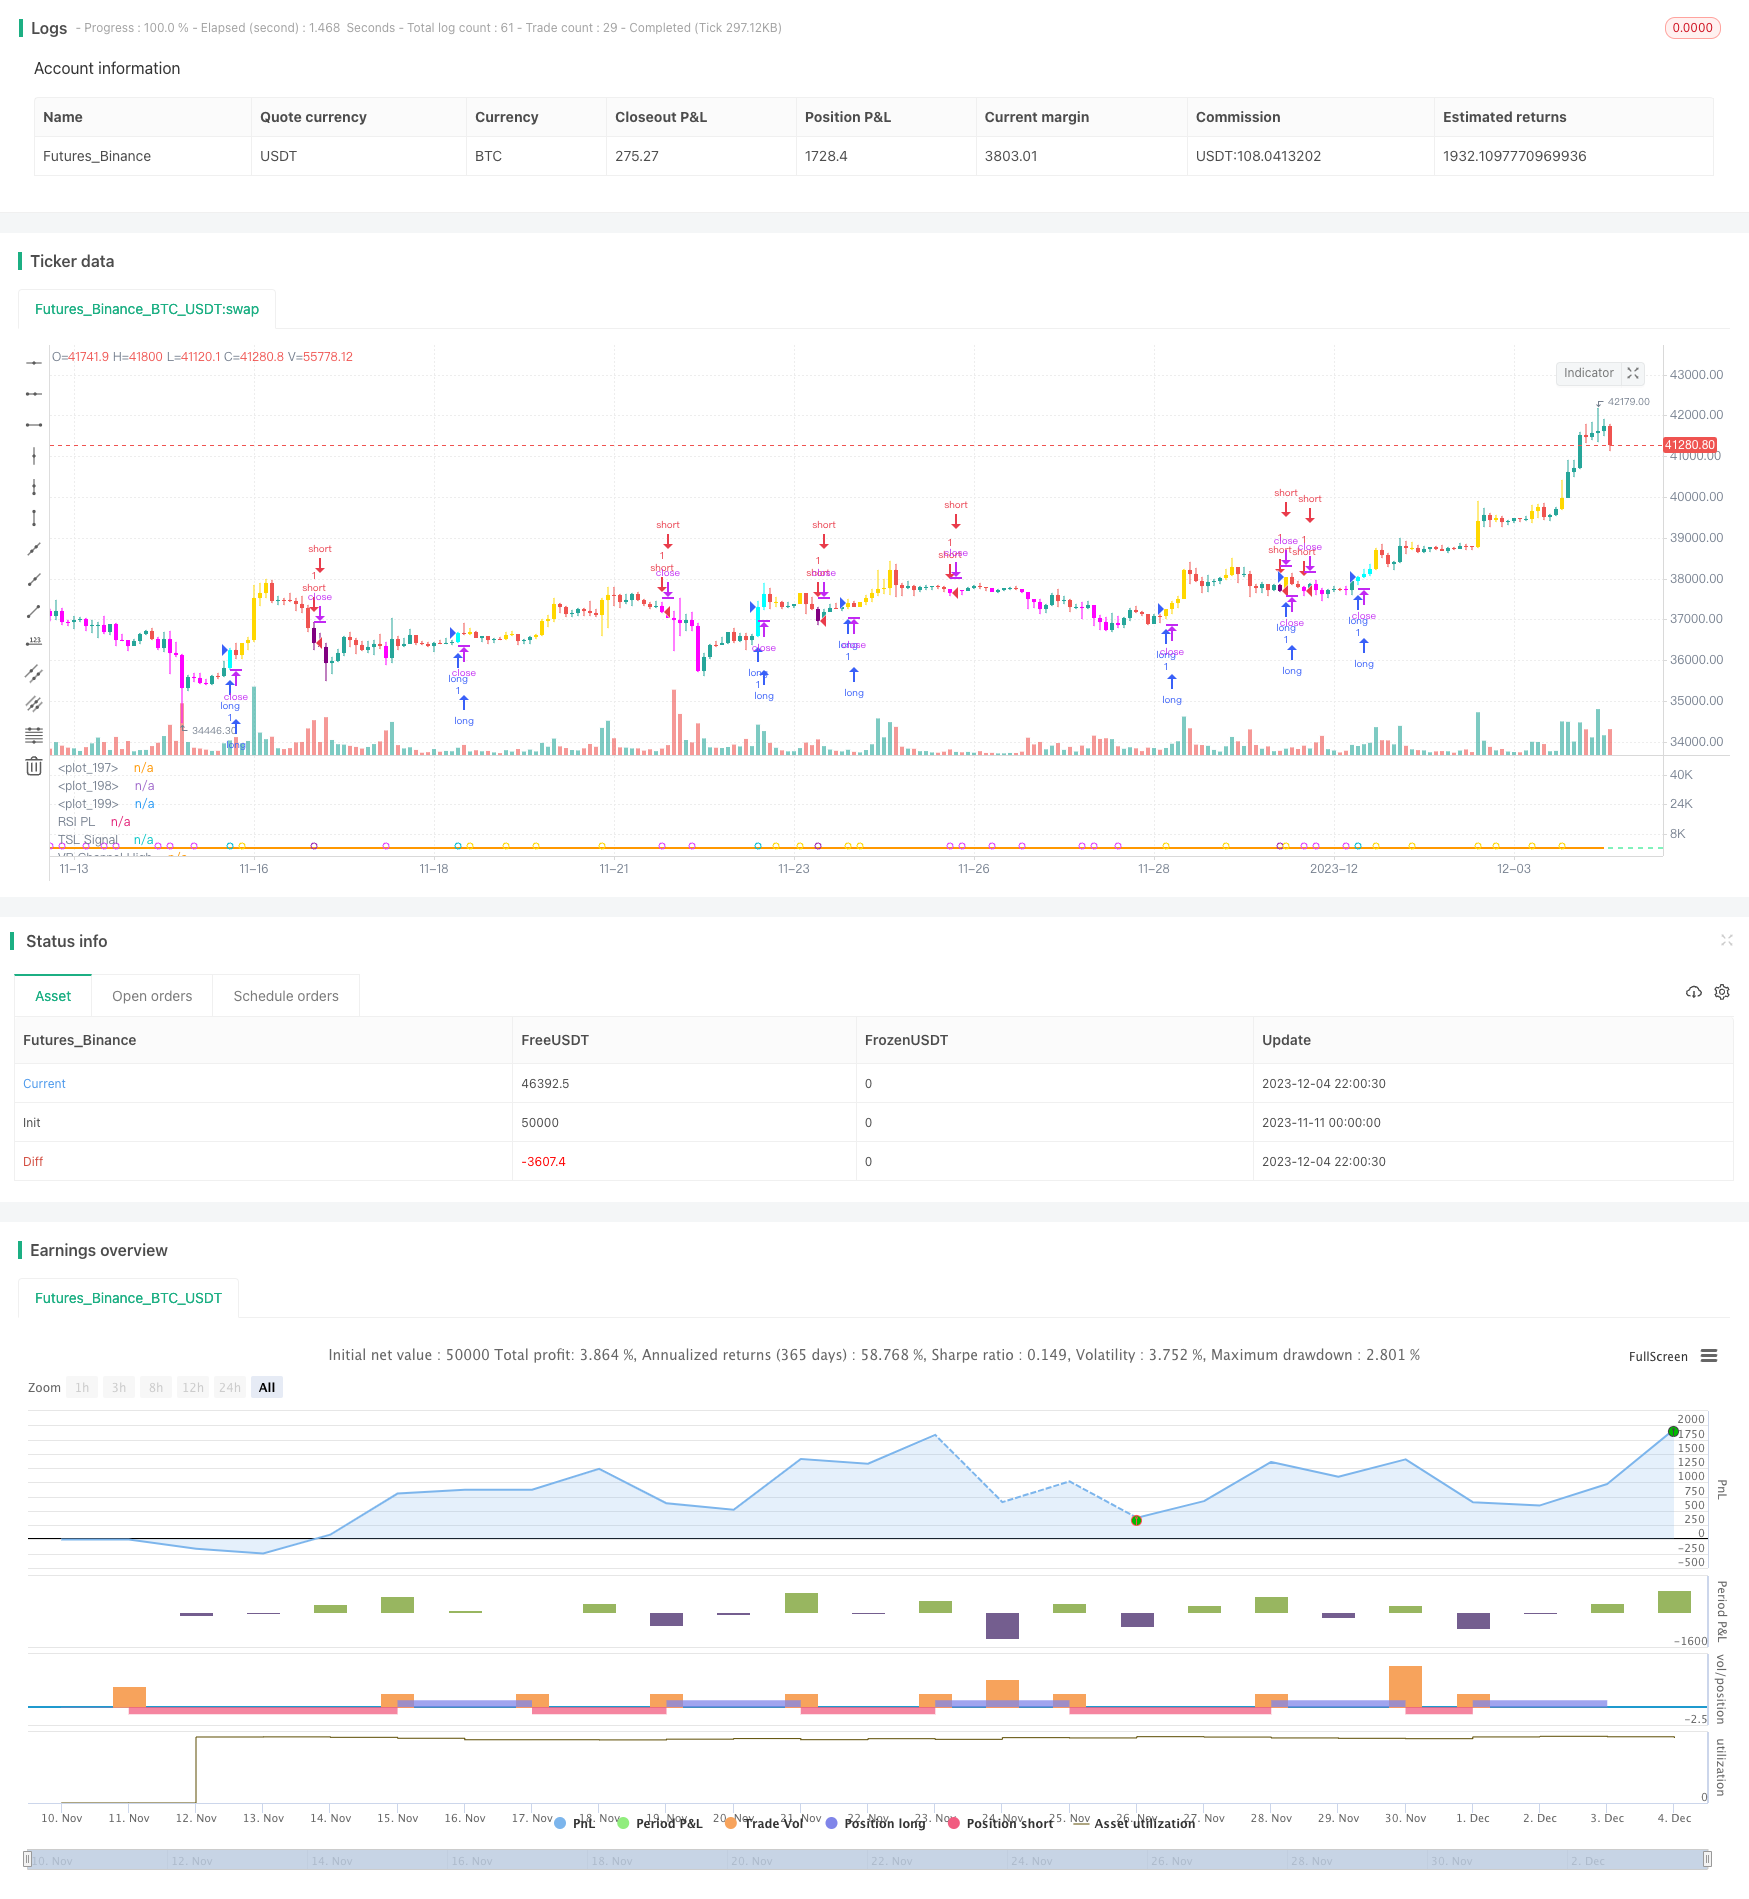
/*backtest
start: 2023-11-11 00:00:00
end: 2023-12-05 00:00:00
period: 2h
basePeriod: 15m
exchanges: [{"eid":"Futures_Binance","currency":"BTC_USDT"}]
*/

//@version=4
//

strategy("[BACKTEST]Traders Dynamic Index Indicator Alert by JustUncleL", shorttitle="[BACKTEST]TDIALT")

//
// author: JustUncleL
// date: 10-Oct-2019
//
// Description:
//   This script is a "strategy" version of the "Traders Dynamic Index Indicator Alert v0.1 by JustUncleL"
//   made available for backtesting to help optimize settings.
//
//   This is a Trend following system utilising the Traders Dynamic Index (TDI),
//   Price Action Channel (PAC) and Heikin Ashi candles.
//   About while ago I came across the use of TDI in "E.A.S.Y. Method" that I found in
//   forexfactory forums: http://www.forexfactory.com/attachment.php?attachmentid=686629&d=1303831008
//   and I was able to set up a chart based on the specifications by using Kurbelklaus scripts.
//   However, I found that the alerts were being generated one or two bars too late,
//   so I was not successful using it with Binary Options. Later I found a variation of the
//   method in the forums which generates alerts a bit earlier, so this indicator is a
//   variation of that early detection version.
//   The indicator can optionally use Heikin  Ashi candles only for all it's calculations,
//   I would recommend viewing the chart with normal Heikin Ashi candles, these
//   smooth out the trends and makes them more visible.
//
//   I found that this metod it works OK with currency pairs or commodities.
//   It also seems to work well with 5min+ timeframe charts,
//   and for Binary Options I would suggest expiry of 2 to 6 candles.
//
//   ALERT GENERATION:
//   =================
//
//   The TDI (Traders Dynamic Index)
//   -------------------------------
//   Volatility Band VB(34), color: Blue, buffer: UpZone, DnZone
//   Relative Strength Index RSI(13)
//   RSI PRICE LINE (2), color: Green, buffer: mab
//   RSI TRADE SIGNAL LINE (7), color: Red, buffer: mbb
//   MARKET BASE LINE MID VB(34), color: Orange, buffer: mid
//
//   Indicator SignalLevels:
//   -----------------------
//   RSI_OversoldLevel : 22 (normally: 32)
//   RSI_OverboughtLevel : 78 (normally: 68)
//
//   Alert Conditions:
//   -----------------
//   Strong Buy (yellow): HIGH>PAC upper && BULL Candle && Candle High>PAC High && RSI>TRADE SIGNAL LINE && RSI>RSI_OversoldLevel &&
//                        && RSI<RSI_OverboughtLevel && TRADE SIGNAL LINE> MARKET BASE LINE
//   Medium Buy (aqua): HIGH>PAC upper && BULL Candle && Candle High>PAC High && RSI>TRADE SIGNAL LINE && RSI>RSI_OversoldLevel
//                        && RSI<RSI_OverboughtLevel && RSI> MARKET BASE LINE && TRADE SIGNAL LINE< MARKET BASE LINE
//   Weak Buy (blue):   HIGH>PAC upper && BULL Candle && Candle High>PAC High && RSI>TRADE SIGNAL LINE && RSI>RSI_OversoldLevel
//                        && RSI<RSI_OverboughtLevel && TRADE SIGNAL LINE<MARKET BASE LINE && RSI< MARKET BASE LINE
//
//   Strong Sell (fuchsia): LOW<PAC lower && BEAR Candle && Candle Low>PAC Low && RSI<TRADE SIGNAL LINE && RSI>RSI_OversoldLevel
//                        && RSI<RSI_OverboughtLevel && TRADE SIGNAL LINE< MARKET BASE LINE
//   Medium Sell (purple): LOW<PAC lower && BEAR Candle && Candle Low>PAC Low && RSI<TRADE SIGNAL LINE && RSI>RSI_OversoldLevel
//                           && RSI<RSI_OverboughtLevel && RSI< MARKET BASE LINE && TRADE SIGNAL LINE> MARKET BASE LINE
//   Weak Sell (black): LOW<PAC lower && BEAR Candle && Candle Low>PAC Low && RSI<TRADE SIGNAL LINE && RSI>RSI_OversoldLevel
//                        && RSI<RSI_OverboughtLevel && TRADE SIGNAL LINE> MARKET BASE LINE && RSI> MARKET BASE LINE
//
//   HIGH LEVEL FILTER (Overbought): RSI>=RSI_OverboughtLevel or MACD Histogram not green
//   LOW LEVEL FILTER (Oversold): RSI<=RSI_OversoldLevel or MACD Histogram not red
//
//   Hints on How to use:
//   --------------------
//   - When a Medium or Strong alert is generated and MACD histogram colour matches the direction
//     of the alert, then place trade in direction of alert candle and MACD.
//   - Use the multi-Hull MA's for trend direction confirmation.
//   - Best positions occur near the MACD(8,16,1) Histogram crossing the zero line.
//   - The optional coloured Dots along the bottom of the indicator represent the first alert
//     of this type that was generated in this sequence.
//   - It is advisable to trade in the direction of the main trend as indicated the HULL MA red cloud:
//     if red cloud underneath PAC then BULLISH trend, if red cloud above PAC then BEARISH trend.
//   - Selecting the HeiKin Ashi candles does affect the MACD and MA caculations, so if you select
//     normal candles the result chart will change. Although the TDI calculations and alerts will stay the
//     same.
//   - When using the Heikin Ashi candles, a good buy entry is indicated by long top wick and no bottom wick
//     for bull (green) candles and good sell entry is indicated by long bottom wick and no top wick for
//     bear (red) candles.
//   - When the MACD histogram is flat and close to zero line,
//     this indicates a ranging market, do NOT trade when this occurs.
//   - When the PAC channel on the main chart is spread apart widely, this is an indication
//     of extreme volitity and choppy chart, do NOT try to trade during these periods.
//     A choppy chart is also indicated by Heikin Ashi candles with long wicks on both sides
//     of the candles.
//   - You can specify what strength level Alerts are generated (default 2):
//     Level (1) means only generate Strong Alerts only.
//     Level (2) means generate Strong and Medium Alerts.
//     Level (3) means generate Strong, Medium and Weak Alerts.
//
//   Modifications:
//   --------------
//     11-Oct-2019
//          - Strategy Version for backtesting created.
//          - Converted to Pinescript V4
//
//     1.3  7-Aug-2017
//          - Modified Alertcondition code so that it only signals on the last completed alerted
//            candle. This should prevent some false alerts and multiple alerts being generated.
//            When setting alarms I suggest using Frequency "Once per bar (on condition)" to get
//            the earliest signal possible.
//          - Added optional alert long/short spikes that only occur on the first Long or Short//      Original code @author LazyBear for basic TDI indicator.

//            signals.
//     1.2  5-Aug-2017:
//          - Added new alerts for Buy and Sell (Long and Short) signals seperately.
//          - Upgraded to version 3 Pinescript.
//          - Added work around patch for opaque bar colouring issue.
//
//     1.1  - Modified code so when viewing Top chart with Heikin Ashi candles, calculations
//            are still based on standard candles, unless Heikin Ashi calculation option selected.
//
//     0.2  - Simplified MACD direction calculation to use just rising/falling.
//     0.1  - Oroginal Version
//   References:
//   -----------
//      Traders Dynamic Index [LazyBear]
//      KK_Traders Dynamic Index_Bar Highlighting by Kurbelklaus
//      KK_Price Action Channel (TDI BH) by Kurbelklaus
//      http://www.forexfactory.com/attachment.php?attachmentid=686629&d=1303831008
//      http://www.forexstrategiesresources.com/trading-system-metatrader-4-iv/504-traders-dynamic-index-how-to-use/
//      http://www.forexfactory.com/showthread.php?t=460148
//      http://www.forexstrategiesresources.com/scalping-forex-strategies-ii/205-scalping-with-tdi-real-macd-stochrainbow/
//
// -----------------------------------------------------------------------------
// Copyright 2016, 2017, 2019 JustUncleL
//
// This program is free software: you can redistribute it and/or modify
// it under the terms of the GNU General Public License as published by
// the Free Software Foundation, either version 3 of the License, or
// any later version.
//
// This program is distributed in the hope that it will be useful,
// but WITHOUT ANY WARRANTY; without even the implied warranty of
// MERCHANTABILITY or FITNESS FOR A PARTICULAR PURPOSE.  See the
// GNU General Public License for more details.
//
// The GNU General Public License can be found here
// <http://www.gnu.org/licenses/>.
//
// -----------------------------------------------------------------------------
//

//
lengthrsi = input(13)
lengthband = input(34)
lengthrsipl = input(2)
lengthtradesl = input(7)
lenH = input(5, minval=1, title="Price Action Channel Length")
lenL = lenH
rsiOSL = input(22, minval=0, maxval=49, title="RSI Oversold Level")
rsiOBL = input(78, minval=51, maxval=100, title="RSI Overbought Level")
strength = input(2, minval=1, maxval=3, step=1, title="Strength Level: (1)Strong (2)Medium (3)All")
sgb = input(false, title="Check Box To Turn Bars Gray")
sbr = input(true, title="Highlight TDI Alert Bars")
sal = input(true, title="Show Alert Condition Status")
uha = input(false, title="Use Heikin Ashi Candles for Calculations")
//

// Constants colours that include fully non-transparent option.
blue100 = #0000FFFF
aqua100 = #00FFFFFF
fuchsia100 = #FF00FFFF
purple100 = #800080FF
gray100 = #808080FF
gold100 = #FFD700FF
white100 = #FFFFFFFF
black100 = #000000FF
gold = #FFD700


// Use only Heikinashi Candles for all calculations or use Standard Candles for calculations.
security_1 = security(heikinashi(syminfo.tickerid), timeframe.period, close)
security_2 = security(syminfo.ticker, timeframe.period, close)
srcClose = uha ? security_1 : security_2
security_3 = security(heikinashi(syminfo.tickerid), timeframe.period, open)
security_4 = security(syminfo.ticker, timeframe.period, open)
srcOpen = uha ? security_3 : security_4
security_5 = security(heikinashi(syminfo.tickerid), timeframe.period, high)
security_6 = security(syminfo.ticker, timeframe.period, high)
srcHigh = uha ? security_5 : security_6
security_7 = security(heikinashi(syminfo.tickerid), timeframe.period, low)
security_8 = security(syminfo.ticker, timeframe.period, low)
srcLow = uha ? security_7 : security_8
//
r = rsi(srcClose, lengthrsi)
ma = sma(r, lengthband)
offs = 1.6185 * stdev(r, lengthband)
upZone = ma + offs
dnZone = ma - offs
mid = (upZone + dnZone) / 2
mab = sma(r, lengthrsipl)
mbb = sma(r, lengthtradesl)
//
hline(rsiOSL, color=color.red, linewidth=1)
hline(50, color=color.black, linewidth=1)
hline(rsiOBL, color=color.lime, linewidth=1)
// Plot the TDI
upl = plot(upZone, color=color.blue, title="VB Channel High", linewidth=2)
dnl = plot(dnZone, color=color.blue, title="VB Channel Low", linewidth=2)
midl = plot(mid, color=color.orange, linewidth=2, title="MBL")
mabl = plot(mab, color=color.green, linewidth=2, title="RSI PL")
mbbl = plot(mbb, color=color.red, linewidth=2, title="TSL Signal")
//
//create RSI TSL cloud to indicate trend direction.
fill(mabl, mbbl, color=mab > mbb ? color.green : color.red, transp=90)

// Calculate Price Action Channel (PAC)
smmaH = 0.0
smmaL = 0.0
sma_1 = sma(srcHigh, lenH)
smmaH := na(smmaH[1]) ? sma_1 : (smmaH[1] * (lenH - 1) + srcHigh) / lenH
sma_2 = sma(srcLow, lenL)
smmaL := na(smmaL[1]) ? sma_2 : (smmaL[1] * (lenL - 1) + srcLow) / lenL
//
umacd = input(false, title="Use MACD Filtering")
fastMA = input(title="MACD Fast MA Length", type=input.integer, defval=8, minval=2)
slowMA = input(title="MACD Slow MA Length", type=input.integer, defval=16, minval=7)
signal = input(title="MACD Signal Length", type=input.integer, defval=1, minval=1)
//
//
[currMacd, _, _] = macd(srcClose[0], fastMA, slowMA, signal)
rising_1 = rising(currMacd, 2)
falling_1 = falling(currMacd, 2)
macdH = currMacd > 0 ? rising_1 ? color.green : color.red :
   falling_1 ? color.red : color.green

//
// Bar - Highlighting  based on indication strength
long = (not umacd or macdH == color.green) and mab > mbb and mab < rsiOBL and
   mab > rsiOSL and srcHigh > smmaH and srcClose > srcOpen ?
   mbb > mid ? 1 : mab > mid and mbb < mid ? 2 : mab < mid and mbb < mid ? 3 : 0 : 0
short = (not umacd or macdH == color.red) and mab < mbb and mab < rsiOBL and
   mab > rsiOSL and srcLow < smmaL and srcClose < srcOpen ?
   mbb < mid ? 1 : mab < mid and mbb > mid ? 2 : mab > mid and mbb > mid ? 3 : 0 : 0
//
// Find the right Bar colour if enabled.
bcolor = not sbr ? na : long == 1 ? gold100 :
   long == 2 and strength > 1 ? aqua100 : long == 3 and strength > 2 ? blue100 :
   short == 1 ? fuchsia100 : short == 2 and strength > 1 ? purple100 :
   short == 3 and strength > 2 ? black100 : sgb ? gray100 : na
//
barcolor(color=bcolor, title="Bars Colours")
//
//
// === ALERT conditions
//
// create alerts only once per sequence type.
//
longCond = long > 0 and long != long[1] and long <= strength
shortCond = short > 0 and short != short[1] and short <= strength

// show dot only when alert condition is met and bar closed.
plotshape(sal and (longCond[1] or shortCond[1]), title="Alert Indicator", location=location.bottom,
          color=long[1] == 1 ? gold : long[1] == 2 ? color.aqua : long[1] == 3 ? color.blue : short[1] == 1 ? color.fuchsia : short[1] == 2 ? color.purple : short[1] == 3 ? color.black : na,
          transp=0, style=shape.circle, offset=-1)
//

// === /ALERT conditions.

// === STRATEGY ===
tradeType = input("BOTH", title="What trades should be taken : ", options=["LONG", "SHORT", "BOTH", "NONE"])

// stop loss
slPoints = input(defval=0, title="Initial Stop Loss Points (zero to disable)", minval=0)
tpPoints = input(defval=0, title="Initial Target Profit Points (zero for disable)", minval=0)

//>>>>>>>>>>>>>>>>>>>>>>>>>>>>>>>>>>>>>>>>>>>>>>>>>>>>>>>>>>>>>>>>>>>>>>>>>>>>>//

testStartYear = input(2018, "Backtest Start Year", minval=1980)
testStartMonth = input(1, "Backtest Start Month", minval=1, maxval=12)
testStartDay = input(1, "Backtest Start Day", minval=1, maxval=31)
testPeriodStart = timestamp(testStartYear, testStartMonth, testStartDay, 0, 0)

testStopYear = input(9999, "Backtest Stop Year", minval=1980)
testStopMonth = input(12, "Backtest Stop Month", minval=1, maxval=12)
testStopDay = input(31, "Backtest Stop Day", minval=1, maxval=31)
testPeriodStop = timestamp(testStopYear, testStopMonth, testStopDay, 0, 0)

testPeriod() =>
    time >= testPeriodStart and time <= testPeriodStop ? true : false

//<<<<<<<<<<<<<<<<<<<<<<<<<<<<<<<<<<<<<<<<<<<<<<<<<<<<<<<<<<<<<<<<<<<<<<<<<<<<<//

//
//set up exit parameters
TP = tpPoints > 0 ? tpPoints : na
SL = slPoints > 0 ? slPoints : na

// Make sure we are within the bar range, Set up entries and exit conditions
if testPeriod() and tradeType != "NONE"
    strategy.entry("long", strategy.long, when=longCond == true and tradeType != "SHORT")
    strategy.entry("short", strategy.short, when=shortCond == true and tradeType != "LONG")
    strategy.close("long", when=shortCond == true and tradeType == "LONG")
    strategy.close("short", when=longCond == true and tradeType == "SHORT")
    strategy.exit("XL", from_entry="long", profit=TP, loss=SL)
    strategy.exit("XS", from_entry="short", profit=TP, loss=SL)

// === /STRATEGY ===
//EOF