윌리엄스의 정교한 오실레이터(AC) 백테스팅 전략

개요
이 전략은 유명한 거래 전문가인 빌 윌리엄스가 설계한 윌리엄스 지표의 정교한 진동기 (Awesome Oscillator, 줄여서 AO) 에 기반하여, 다른 주기에서 평균값의 차이를 계산하여 진단 트렌드 및 시장 동력의 진동 지표를 형성하고, 구매 및 판매를 안내하기 위해 적절한 거래 신호를 설계합니다.
전략 원칙
이 전략의 핵심 지표는 정교한 진동기 (AO) 이며, 계산 공식은 다음과 같다.
AO = SMA ((중간 가격, 5일) - SMA ((중간 가격, 34일)
그 중, 중간값은 ((최고 가격 + 최저 가격) / 2 ᄂ으로 정의된다. 이 공식은 두 개의 다른 주기에서 중간값 SMA에서 가격 운동 정보를 추출한다. 빠른 라인 SMA ((5 일) 과 느린 라인 SMA ((34 일) 의 차이를 계산하여, 빠른 라인이 느린 라인보다 높을 때 구매 신호를 발산하고, 빠른 라인이 느린 라인보다 낮을 때 판매 신호를 발산한다.
이 전략에서, 오차 신호를 필러하기 위해, AO에 대해 5 일 SMA 작업이 수행되기도 한다. 그리고 반전 모드를 설정하여, 긴/단한 신호를 반전하여 다른 거래 방향을 달성 할 수 있다. AO가 이전보다 높으면 구매 기회로 간주되어 파란색 기둥으로 표시되며, AO가 이전보다 높지 않으면 판매 기회로 간주되어 빨간 기둥으로 표시된다.
전략적 이점
- 마감가 아닌 중간값을 사용해서, 가짜 브레이크가 SMA에 미치는 영향을 줄이고, 안정성을 높일 수 있다.
- SMA를 빠르게 결합하여 시장 변화에 민감하게 대응할 수 있습니다.
- SMA 듀얼 필터, 고주파 노이즈를 제거, 신호 품질을 향상
- 다양한 시장 환경에 적응할 수 있는 유연한 변수 조정
- 직관적인 기둥 모양으로 매매점을 표시하여 쉽게 판단할 수 있습니다.
위험과 해결책
- 시장의 변동 빈도를 신중하게 평가하고, 과도한 조화를 방지하기 위해 매개 변수를 조정하십시오.
- 불안한 시장에서 여러 번의 오작동이 발생할 수 있다. 적절히 휴식범위를 완화하거나 포지션 규모를 줄일 수 있다.
- 회적 데이터는 신뢰할 수 없으며, 실체는 시뮬레이션과 다를 수 있다. 여러 조합의 실체 검증을 권장하고, 분량으로 창고를 건설한다.
최적화 방향
- 트랜스포메이션 지표와 같은 필터링을 추가하여 신호 품질을 향상시킵니다.
- 단독 손실을 통제하기 위해 Stop Loss Strategies에 가입하십시오
- 포지션 관리를 최적화하여 시장의 변동에 따라 포지션을 늘리고 줄입니다.
- 다른 지표와 함께 트렌드 방향을 판단하여 흔들리는 시장의 반전을 방지합니다.
요약하다
이 전략은 중저가 느린 SMA 구조 설계의 정교한 흔들기를 활용하여 시장 동력의 변화를 진단하고, 거래 신호는 직관적입니다. 그러나 흔들림과 반전의 영향을 받을 수 있으며, 안정성을 높이기 위해 매개 변수와 중지 전략을 적절하게 조정해야합니다. 위험을 제어하는 전제 하에서 이 전략은 간단하고 실용적이며, 추가 최적화 적용 가치가 있습니다.
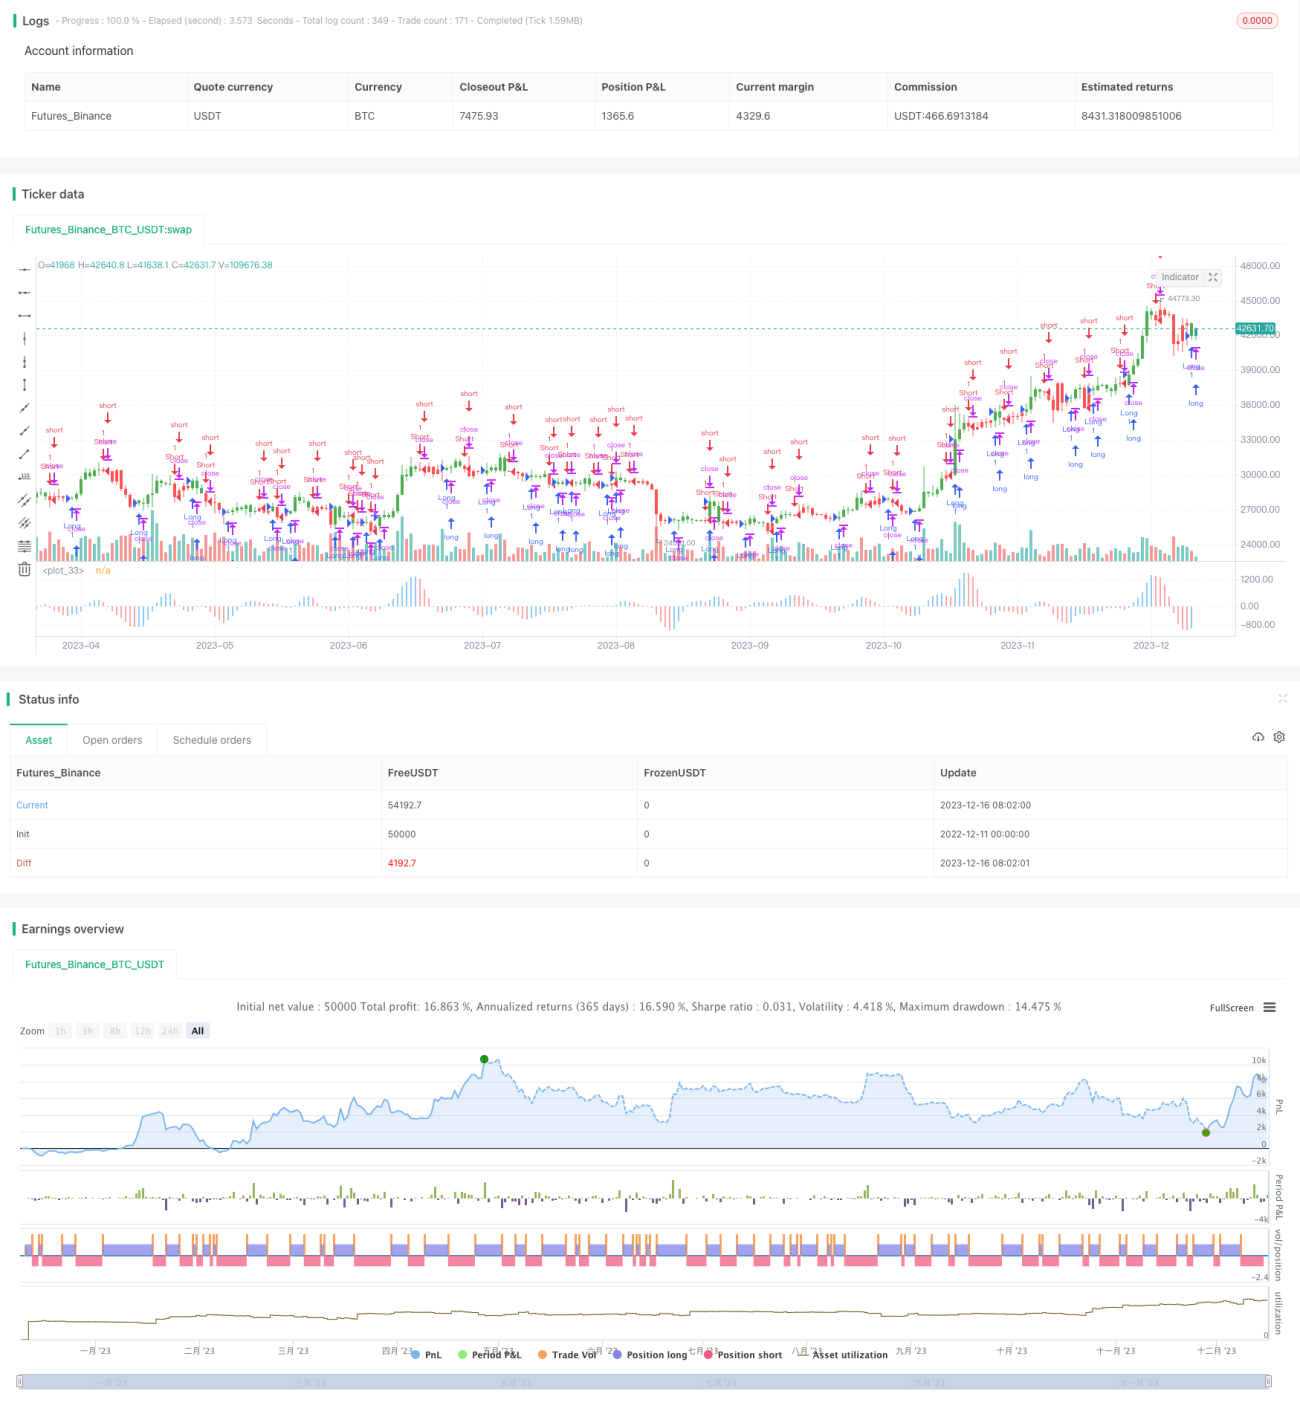
/*backtest
start: 2022-12-11 00:00:00
end: 2023-12-17 00:00:00
period: 1d
basePeriod: 1h
exchanges: [{"eid":"Futures_Binance","currency":"BTC_USDT"}]
*/

//@version=2
////////////////////////////////////////////////////////////
//  Copyright by HPotter v1.0 28/12/2016
// This indicator plots the oscillator as a histogram where blue denotes - 1