
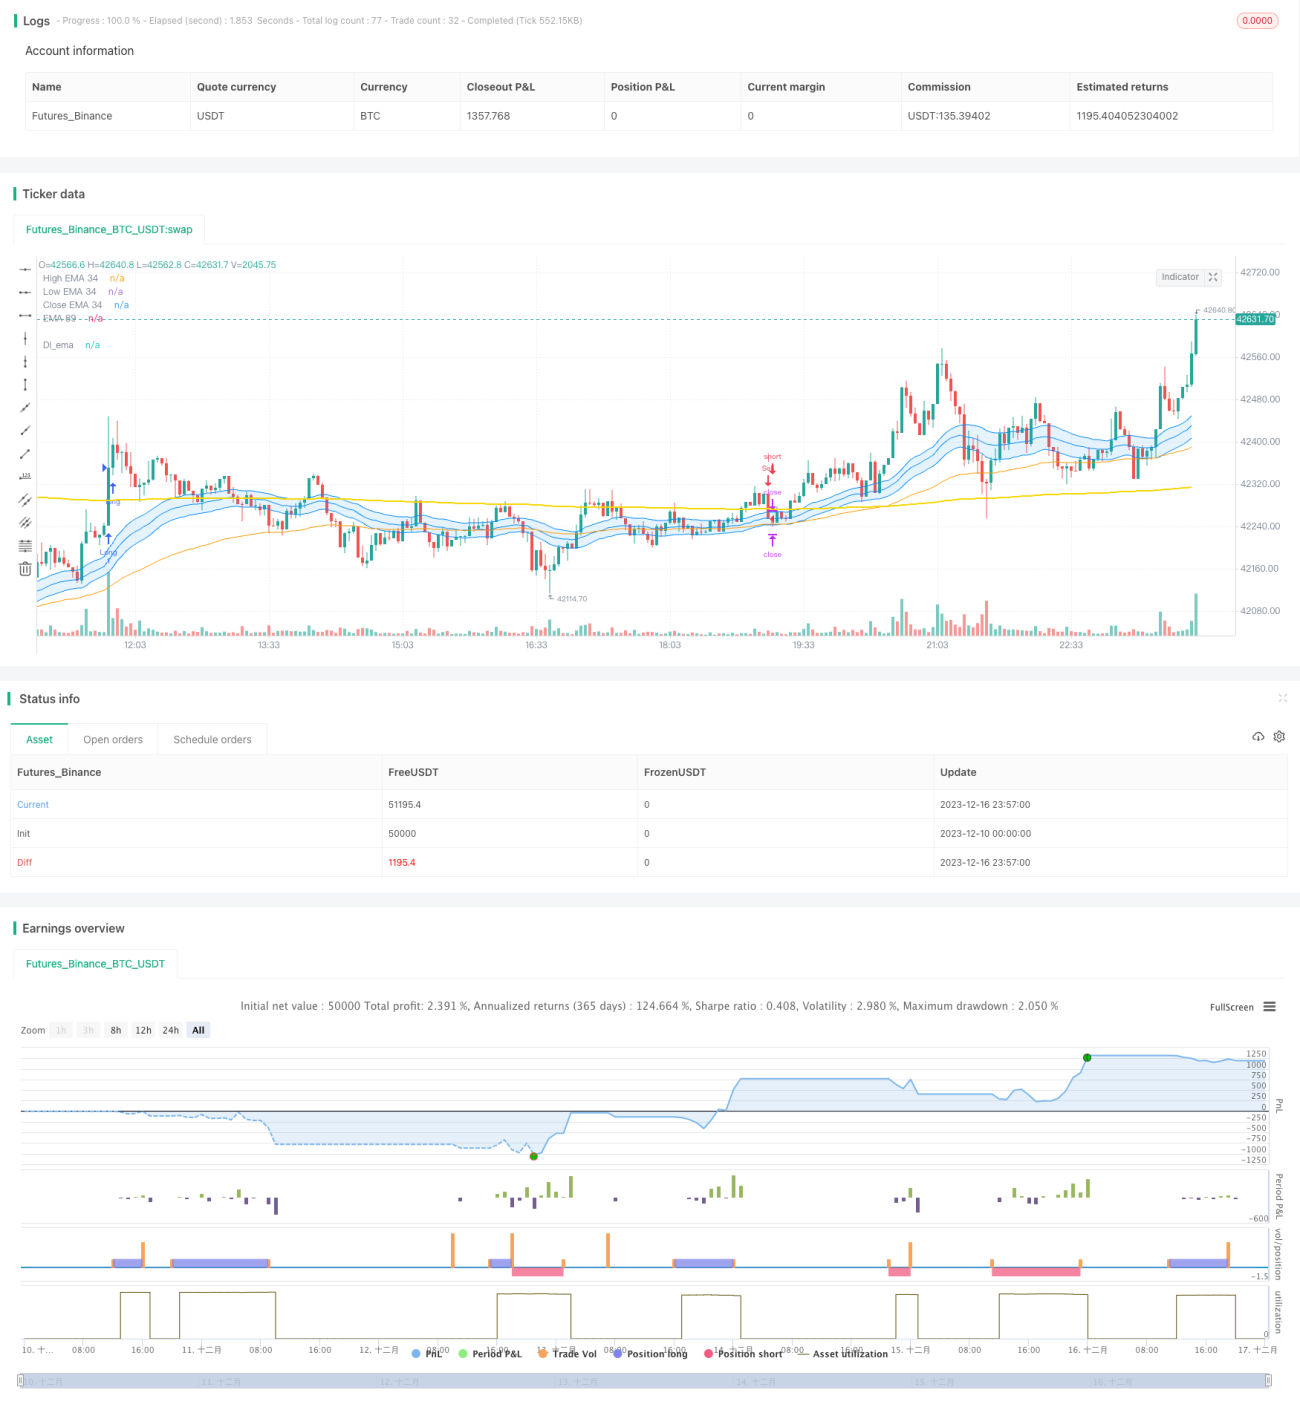
이 전략은 운동량 지표와 평균선 지표를 결합한 트렌드 추적 전략이다. 이 전략은 지수 이동 평균을 주요 트렌드 판단 도구로 사용하고, 높은 거래량과 결합하여 구매 및 판매 신호를 발송한다. 이 전략은 중장선 포지션을 보유하여 시장의 주요 트렌드를 추적하는 데 적합하다.
34주기의 EMA를 주요 트렌드 판단 도구로 사용한다. 가격이 EMA를 상회할 때 호불호 신호이며, EMA를 상회할 때 하락 신호이다.
거래의 21일 이동 평균을 최근 평균의 1.5배와 비교한다. 현재 거래량이 평균의 1.5배 이상이면 높은 거래량으로 간주한다.
가격과 EMA가 골드 포크를 형성하고 고량일 때만 구매 신호를 발송한다. 가격과 EMA가 골드 포크를 형성하고 고량일 때만 판매 신호를 발송한다.
포지션 개설 후 스톱로스 및 스톱 비율을 설정할 수 있으며, 사용자 정의 설정이 가능합니다.
이런 식으로, 트렌드, 동력 및 위험 관리와 같은 여러 요소들을 종합적으로 고려하여, 비교적 포괄적이고 안정적입니다.
EMA를 사용하여 시장의 주요 트렌드 방향을 판단하여 중장선 트렌드를 효과적으로 추적할 수 있다.
높은 거래량과 함께 FILTER를 사용하면 가짜 돌파구를 오해하지 않을 수 있습니다.
스톱로스 스톱 비율을 설정하여 단일 거래의 위험을 효과적으로 제어할 수 있습니다.
중·장선 지분 전략으로, 고주파 시장 소음으로부터 영향을 받지 않고, 안정적으로 지분한다.
높은 주파수 가짜 침입에 의해 오도될 가능성이 높습니다. 해결책은 거래량 검증을 추가하는 것입니다.
중장선 포지션 보유는 자금 점유를 증가시킨다. 해결책은 포지션 규모를 적절히 통제하는 것이다.
평행선 거래 전략은 늦어지고 단선 기회를 잡지 못할 수 있다. 해결책은 다른 단선 신호와 결합하는 것이다.
대폭동 시 큰 손실이 발생할 수 있다. 해결책은 적절한 손실을 중지하는 위치를 설정하는 것이다.
다양한 EMA 주기 변수의 장단점을 테스트하여 최적의 변수를 찾습니다.
전략의 수익률과 리스크 저항성에 대한 다른 스톱 로즈 스톱 비율의 변수의 영향을 테스트한다.
MACD, KDJ와 같은 다른 지표와 함께 짧은 라인 기회를 판단하는 것을 시도하십시오.
포지션 제어, 동적 중지 손실과 같은 자금 관리 전략을 최적화하십시오.
이 전략은 전반적으로 가치 안정적인 중장선 포지션 전략이다. 그것은 시장의 주요 추세를 효과적으로 추적하고 양력 지표를 사용하여 오도 신호를 필터링 할 수 있다. 동시에, 적절한 중지 및 차단 방법을 사용하여 단편 거래의 위험을 제어한다. 추세 거래의 고정 상장을 청결하는 일이라 할 수 있다. 적절한 최적화가 이루어지면 더 이상적인 전략 수익률을 얻을 수 있다고 믿는다.
/*backtest
start: 2023-12-10 00:00:00
end: 2023-12-17 00:00:00
period: 3m
basePeriod: 1m
exchanges: [{"eid":"Futures_Binance","currency":"BTC_USDT"}]
*/
// This source code is subject to the terms of the Mozilla Public License 2.0 at https://mozilla.org/MPL/2.0/
// © TradingSignalHub
//@version=5
strategy("Di strategy ", overlay=true)
//date setting
fromDay = input(defval = 1, title = "Ngày bắt đầu", group = "Cài đặt thời gian")
fromMonth = input(defval = 1, title = "Tháng bắt đầu", group = "Cài đặt thời gian")
fromYear = input(defval = 2023, title = "Năm bắt đầu", group = "Cài đặt thời gian")
toDay = input(defval = 31, title = "Đến ngày", group = "Cài đặt thời gian")
toMonth = input(defval = 12, title = "Đến tháng", group = "Cài đặt thời gian")
toYear = input(defval = 2033, title = "Đến năm", group = "Cài đặt thời gian")
startDate = timestamp(fromYear, fromMonth, fromDay, 00, 00)
finishDate = timestamp(toYear, toMonth, toDay, 00, 00)
time_cond() =>
time >= startDate and time <= finishDate ? true : false
//snr setting
price = close
ema34 = input.int(34, minval=2, title="EMA 34", group = "Cài đặt EMA")
pacC = ta.ema(close,ema34)
pacL = ta.ema(low,ema34)
pacH = ta.ema(high,ema34)
L =plot(pacL, color=color.rgb(3, 139, 251), linewidth=1, title="High EMA 34")
H =plot(pacH, color=color.rgb(3, 137, 247), linewidth=1, title="Low EMA 34")
C =plot(pacC, color=color.rgb(4, 138, 248), linewidth=1, title="Close EMA 34")
fill(L,H, color=color.rgb(33, 149, 243, 85),title="Fill dãi EMA 34")
//EMA full setting
ema89 =ta.ema(close,89)
DIema= ta.ema(close,458)
plot(DIema,title="DI_ema",color=color.rgb(247, 214, 3),linewidth=2)
plot(ema89,title="EMA 89",color=color.orange,linewidth=1)
//ema200= ta.ema(close,200)
//ema610= ta.ema(close,610)
//ema144= ta.ema(close,144)
//ema258= ta.ema(close,258)
//plot(ema200,title="EMA 200",color=color.purple,linewidth=2)
//plot(ema610,title="EMA 610",color=color.white,linewidth=2)
//plot(ema144,title="144Banker",color=color.green,linewidth=1)
//plot(ema258,title="258Banker",color=color.yellow,linewidth=1)
EMAbuy = ta.crossover(price, DIema)
EMAsell = ta.crossunder(price, DIema)
//volume setting
vol = (volume)
length = input(21, "Đường Trung Bình Vol", group = "Cài đặt Volume" )
div = input(1.5, "Mức trung bình", group = "Cài đặt Volume" )
up = close > open
down = open>close
Volhigh = volume> (ta.ema(volume, length)*div)
//Cài đặt lệnh
longCondition = EMAbuy and Volhigh
if time_cond()
if (longCondition)
strategy.entry("Long", strategy.long)
shortCondition = EMAsell and Volhigh
if time_cond()
if (shortCondition)
strategy.entry("Sell", strategy.short)
stopPer = input.float(1.0, title="Stop Loss %", group = "Cài đặt TP & SL %" ) / 100
takePer = input.float(2.0, title="Take Profit %", group = "Cài đặt TP & SL %" ) / 100
// Determine where you've entered and in what direction
longStop = strategy.position_avg_price * (1 - stopPer)
shortStop = strategy.position_avg_price * (1 + stopPer)
shortTake = strategy.position_avg_price * (1 - takePer)
longTake = strategy.position_avg_price * (1 + takePer)
if strategy.position_size > 0
strategy.exit(id="Đóng Long", stop=longStop, limit=longTake)
if strategy.position_size < 0
strategy.exit(id="Đóng Sell", stop=shortStop, limit=shortTake)
alertcondition(longCondition, title = "Tín hiệu BUY", message = "Tín hiệu BUY")
alertcondition(shortCondition, title = "Tín hiệu SELL", message = "Tín hiệu SELL")
//PLOT FIXED SLTP LINE
//plotshape(strategy.position_size > 0 ? longStop : na, shape.labelup, color=color.rgb(34, 249, 6, 50), linewidth=1, title="Long SL")
//plot(strategy.position_size < 0 ? shortStop : na, style=plot.style_circles, color=color.rgb(250, 8, 8, 50), linewidth=1, title="Short SL")
//plot(strategy.position_size > 0 ? longTake : na, style=plot.style_linebr, color=color.rgb(59, 248, 7), linewidth=1, title="Long TP")
//plot(strategy.position_size < 0 ? shortTake : na, style=plot.style_linebr, color=color.rgb(247, 7, 7), linewidth=1, title="Short TP")