슈퍼 트렌드 팔로잉 스톱 로스 전략

개요
이 전략은 오버트렌드 지표와 트래킹 스톱로스를 기반으로 포지션을 개시하고 평화 포지션을 설정한다. 4 개의 경보를 사용하여 평화 포지션을 개시하고 오버트렌드 전략을 사용합니다. 이 전략은 로봇 설계에 특화된 트래킹 스톱 기능이 있다.
전략 원칙
이 전략은 ATR 지표를 사용하여 경로와 경로를 계산한다. 상쇄 가격이 경로를 돌파 할 때 구매 신호를 생성하고, 경로를 돌파 할 때 판매 신호를 생성한다. 전략은 또한 트렌드 방향을 판단하기 위해 초 트렌드 라인을 사용합니다. 초 트렌드 라인을 통과하면 황소 시장이 시작된다는 것을 나타냅니다. 초 트렌드 라인을 통과하면 곰 시장이 시작된다는 것을 나타냅니다. 전략은 신호를 생성 할 때 입장을 열고, 동시에 초기 중지 손실 가격을 설정합니다.
우위 분석
이 전략은 트렌드 방향을 판단하는 초트렌드 지표와 ATR 지표의 스톱로스 설정의 장점을 결합하여 가짜 브레이크를 효과적으로 필터링 할 수 있습니다. 스톱로스를 추적하면 수익을 잘 고정하고 회수를 줄일 수 있습니다. 또한, 이 전략은 로봇을 위해 특별히 설계되어 자동화 거래가 가능합니다.
위험 분석
초 트렌드 지표는 더 많은 잘못된 신호를 생성하기 쉽다. 스톱 가격 조정이 큰 경우, 스톱 손실이 뚫리는 확률이 높아진다. 또한, 로봇 거래는 서버 다운, 네트워크 중단 등의 기술 위험에 직면합니다.
잘못된 신호의 가능성을 줄이기 위해 ATR 파라미터를 적절히 조정하거나 다른 지표를 추가하여 필터링 할 수 있습니다. 스톱 손실 추적 폭을 조정할 때 수익성과 위험을 균형을 잡아야합니다. 또한 기술 장애의 위험을 방지하기 위해 백업 서버와 네트워크를 준비하십시오.
최적화 방향
이 전략은 다음과 같은 부분에서 최적화될 수 있습니다.
-
입력 신호를 필터링하여 잘못된 신호를 피하기 위해 지표 또는 조건을 추가하십시오. 예를 들어 MACD 지표가 추가 될 수 있습니다.
-
다양한 ATR 변수 조합을 테스트하여 최적의 변수를 찾을 수 있다.
-
스탠포드 스탠포드 스탠포드 스탠포드 스탠포드 스탠포드 스탠포드
-
더 많은 스톱스피가 추가되어 스톱스피가 이루어질 수 있습니다.
-
메인 백업 쌍 서버 구조를 구축할 수 있으며, 메인 서버가 고장 났을 때 빠르게 전환할 수 있다.
요약하다
이 전략은 오버 트렌드 지표와 트래킹 스톱의 장점을 통합하여 포지션 개시 및 스톱을 자동화 할 수 있습니다. 실장에서의 최적화 방향의 개선 조치는 매우 실용적인 양적 거래 전략이 될 수 있습니다.
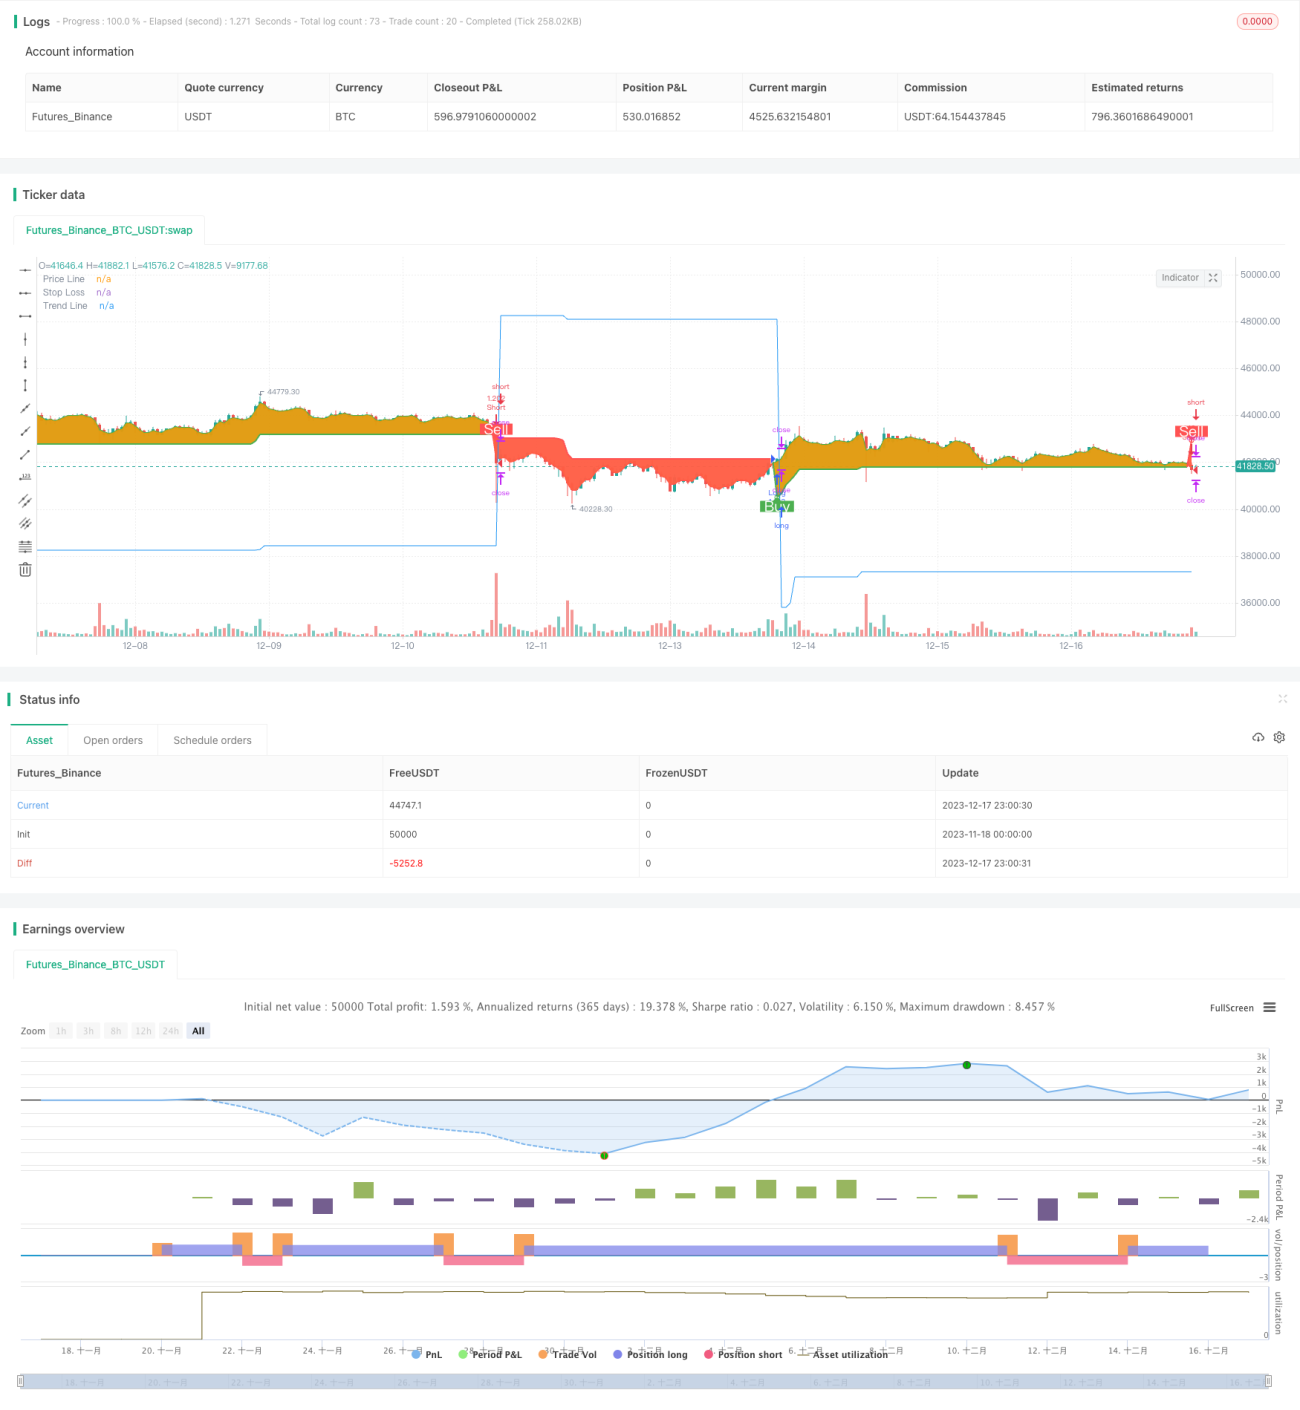
/*backtest
start: 2023-11-18 00:00:00
end: 2023-12-18 00:00:00
period: 1h
basePeriod: 15m
exchanges: [{"eid":"Futures_Binance","currency":"BTC_USDT"}]
*/

// This source code is subject to the terms of the Mozilla Public License 2.0 at https://mozilla.org/MPL/2.0/
// © arminomid1375
//@version=5
strategy('Mizar_BOT_super trend', overlay=true, default_qty_value=100, currency=currency.USD, default_qty_type=strategy.percent_of_equity, initial_capital=100, max_bars_back=4000)- 1