듀얼 인디케이터 하이브리드 양적 거래 전략


생성 날짜: 2023-12-20 10:31:06 마지막으로 수정됨: 2023-12-20 10:31:06
복사: 0 클릭수: 611
avatar of ChaoZhang ChaoZhang
1
집중하다
1621
수행원

듀얼 인디케이터 하이브리드 양적 거래 전략

개요

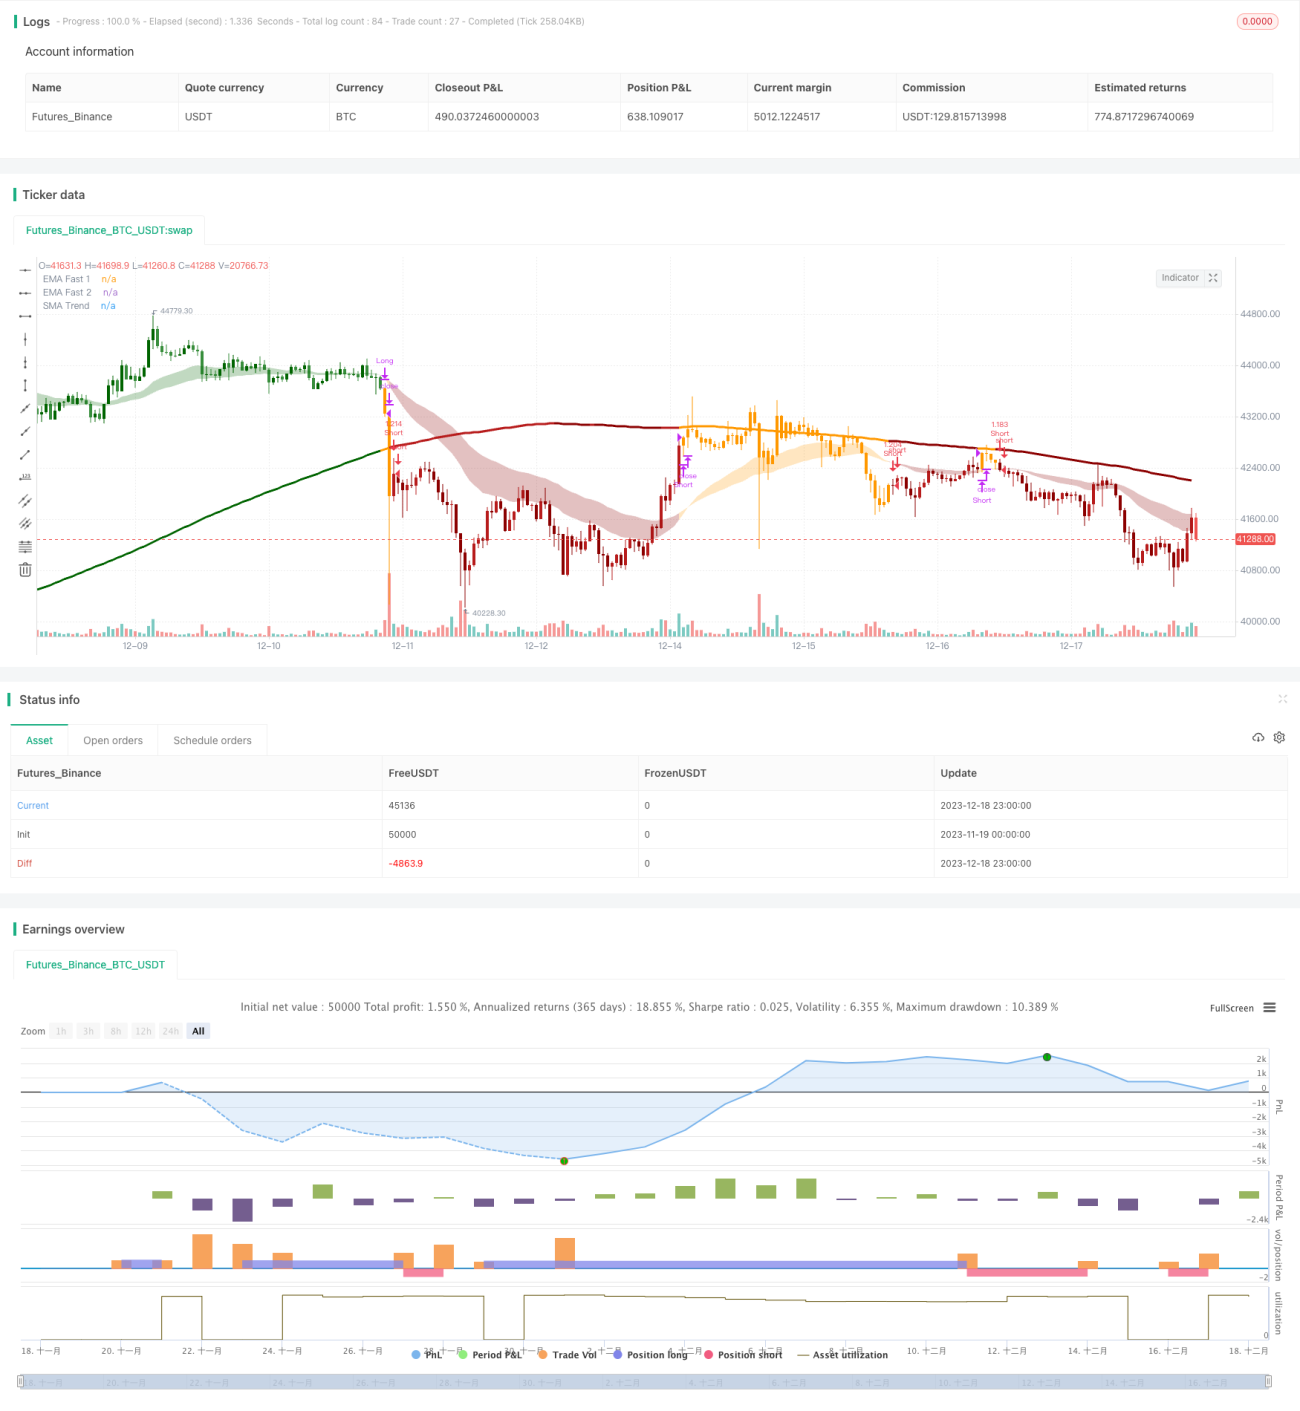
이 전략은 트렌드 방향을 식별하고 트레이딩을 수행하기 위해 이중 지표를 결합합니다. 첫째, 단기 트렌드를 판단하기 위해 두 개의 이동 평균 (고속선과 중속선) 의 교차를 사용합니다. 둘째, 주요 트렌드 방향을 판단하기 위해 채널 범위를 사용하고 장기 이동 평균을 사용합니다. 두 가지 판단 결과가 일치하면 거래 신호가 발생합니다.

전략 원칙

이 전략은 세 가지 지표의 집합을 사용하여 판단한다. 첫째, 빠른 라인 EMA ((26주기) 와 중간 라인 EMA ((50주기) 의 금색 포크는 단기 트렌드를 판단한다. 둘째, 통로 범위를 계산하여 가격이 그 범위를 돌파했는지 판단하여 중기 트렌드의 빈도를 판단한다. 마지막으로, 긴 평균 라인 SMA ((200주기) 를 계산하여 가격과 비교하여 주요 트렌드 방향을 판단한다.

이 논리는 다음과 같습니다:

  1. 빠른 선과 중간 선의 교차 (金叉看,死叉看跌) 가 단기 경향 방향을 판단한다.

  2. 가격이 통로 범위를 뚫었는지 여부를 판단하여 중기 트렌드 방향을 결정한다. 통로 범위는 장기 평균선과 ATR을 줄이는 데 기초하여 한 계수를 곱한다. 가격이 상한을 뚫면 낙점으로; 하한을 넘으면 낙점으로.

  3. 가격과 장기 평균의 사이즈 관계를 비교하여 주요 트렌드 방향을 판단한다.

마지막으로, 단, 중, 긴 3개의 판단 결과가 모두 일치할 때만 거래 신호를 발송한다. 이러한 혼합 판단은 가짜 신호를 효과적으로 필터링하여 안정성을 높일 수 있다.

전략적 이점

이 두가지 지표가 혼합된 전략에는 몇 가지 장점이 있습니다.

  1. 가짜 신호를 효과적으로 필터링하여 안정성을 높일 수 있습니다. 거래 신호는 단, 중, 긴 여러 지표 결과의 검증이 필요하기 때문에 단일 지표로 인한 잘못된 신호를 피할 수 있습니다.

  2. 유연성이 높으며, 시장에 따라 지표 매개 변수를 조정할 수 있다. 급속한 평균선과 통로 범위의 매개 변수는 조정할 수 있으며, 다른 시장 환경에 적합하다.

  3. 트렌드 트레이딩과 레지오 트레이딩을 결합한다. 중단기 지표는 트렌드를 잡고, 장기 지표는 레지오를 결정한다. 전체적으로 트렌드 및 반전 전략의 장점을 갖는다.

  4. 자금 사용 효율성이 높다. 여러 지표 결과가 일치하는 경우에만 주문을 할 수 있으며, 자금을 효과적으로 활용하여 불필요한 거래를 피할 수 있다.

전략적 위험

이 전략에는 몇 가지 위험도 있습니다.

  1. 매개 변수 설정 위험. 이동 평균 주기 및 통로 범위 매개 변수는 합리적인 설정이 필요하며, 적절하지 않으면 트렌드를 효과적으로 발견할 수 없거나 너무 많은 잘못된 신호를 유발할 수 있습니다.

  2. 이중 지표는 거래 기회의 비용을 증가시킵니다. 단일 지표 전략에 비해 일부 거래 기회를 놓칠 수 있으며, 최적의 지점에서 입출력을 할 수 없습니다.

  3. 중단 손실 전략은 신중해야합니다. 이 전략의 돌파구 중단 손실 메커니즘은 불필요한 손실을 초래할 수 있으므로 중지 손실 비율을 신중하게 설정해야합니다.

  4. 큰 변동이 있는 시장에서는 효과가 좋지 않을 수 있다. 이 전략은 트렌드가 뚜렷한 시장 환경에 더 적합하다.

전략 최적화 방향

이 전략은 다음과 같은 부분에서 최적화될 수 있습니다.

  1. 다양한 변수 조합을 테스트하여 최적의 변수를 찾습니다. 더 많은 역사 데이터 테스트를 통해 최적의 변수 설정을 찾을 수 있습니다.

  2. 적응형 스톱 손실 메커니즘을 추가한다. VOLTAILITY INDICATOR와 함께 스톱 손실을 동적으로 조정할 수 있다.

  3. 양력 지표 보조 판단. 핵심 지점에서 보조 판단 포지션 크기를, 자금 사용 효율을 높인다.

  4. 입학 논리를 최적화한다. 입학 한 번에 대한 위험을 줄이기 위해 입학 한 번에 대한 비용 평균 전략에 대해 더 많이 고려한다.

  5. 기계학습 모델과 결합하여 판단한다. 신경망과 같은 모델을 도입하여 모델의 튼튼성과 적합성을 판단한다.

요약하다

이 전략은 빠른 중장기 트리플 지표 판단과 이중 검증 메커니즘을 통해 가짜 신호를 효과적으로 억제하고 안정성을 향상시킬 수 있습니다. 동시 동시 트렌드 거래와 간격 거래의 장점을 겸비하고, 자금 사용 효율이 높습니다. 매개 변수 최적화, 정지 손실 최적화, 양적 에너지 지표 결합 등 여러 가지 방법으로 개선 할 수 있으며, 혼합 양형화 전략으로 권장됩니다.

전략 소스 코드
/*backtest
start: 2023-11-19 00:00:00
end: 2023-12-19 00:00:00
period: 1h
basePeriod: 15m
exchanges: [{"eid":"Futures_Binance","currency":"BTC_USDT"}]
*/

//@version=5
// Indicator to combines:
//           Trend Channel[Gu5] (SMA 200) +
//           EMA's cross  (26, 50 ) +
//           Golden Cross (50, 200)
// Author: @gu5tavo71 08/2019
// v2.3.6, 2022.02.18
// Trend Channel [Gu5] // Author: @gu5tavo71 08/2019
//
// This source code is subject to these terms:
// Attribution-NonCommercial 4.0 International (CC BY-NC 4.0)
// https://www.safecreative.org/work/2202190517452-mix1-ema-cross-trend-channel-gu5-
// You are free to:
// Share, copy and redistribute this script
// Adapt, transform and build on this script
// Under the following terms:
// Non-commercial: You cannot sell my indicator. You can't sell my work.
// Attribution: If you post part of my code, you must give me proper credit
//
// I am using part of this code published by @PineCoders and Public Library
// Disclaimer: I am not a financial advisor.
//             For purpose educate only. Use at your own risk.
strategy(title = 'Mix1 : Ema Cross + Trend Channel [Gu5] - Backtest', shorttitle = 'Mix01', overlay = true,
  initial_capital = 100,
  default_qty_value = 100,
  default_qty_type = strategy.percent_of_equity,
  commission_value = 0.075,
  commission_type = strategy.commission.percent,
  format = format.price,
  precision = 2,
  process_orders_on_close = true)


// ---------   Inputs                       "=============================="           |
i_maSrc      = input.source     (close,     'MA Source'                     , group    = 'EMAs')
i_maFast1    = input.int        (26,        'EMA Fast'                      , group    = 'EMAs')
i_maFast2    = input.int        (50,        'EMA Medium'                    , group    = 'EMAs')
i_maLen      = input.int        (200,       'MA Trend'                      , group    = 'Trend Channel')
o_maLen1     =                              'EMA'
o_maLen2     =                              'SMA'
i_maLenSel   = input.string     (o_maLen2,  'MA Type'                       , group    = 'Trend Channel',
               options = [o_maLen1, o_maLen2],
               tooltip = "EMA or SMA")
i_htf        = input.timeframe  ('',        'Select Higher Timeframe'       , tooltip  = 'Only for MA Trend'  , group    = 'Trend Channel')
i_rangeLen   = input.float      (0.618,     'Channel Range Length'          , tooltip  = 'ATR of the MA Trend', group    = 'Trend Channel')
i_slOn       = input.bool       (false,     '■ Stop Loss On/Off'            , group    = 'Stop Loss')
i_sl         = input.float      (2.618,     'SL %'                          , step     = 0.1, group    = 'Stop Loss')
i_periodSw   = input.bool       (true,      '■ Period On/Off'               , group    = 'Period')
o_start      = timestamp        (           '2020-01-01 00:00 GMT-3'        )
o_end        = timestamp        (           '2099-12-31 00:00 GMT-3'        )
i_periodStar = input       (o_start,   'Start Time'                    , group    = 'Period')
i_periodEnd  = input       (o_end,     'End Time'                      , group    = 'Period')
o_posSel1    =                              'Only Long'
o_posSel2    =                              'Only Short'
o_posSel3    =                              'Both'
i_posSel     = input.string     (o_posSel3, 'Position Type'                 , group   = 'Strategy',
               options = [o_posSel1, o_posSel2, o_posSel3],
               tooltip = "Only Long, Only short or Both")
o_typeS1     =                              'Strategy 1'
o_typeS2     =                              'Strategy 2'
i_typeS      = input.string     (o_typeS2,  'Strategy Type'                 , group   = 'Strategy',
               options = [o_typeS1, o_typeS2],
               tooltip = "Strategy 1:\nLong, when the price (close) crosses the ema.\nStrategy 2:\nLong, only when ema goes up")
i_barColOn   = input.bool       (true,      '■ Bar Color On/Off'            , group   = 'Display')
i_alertOn    = input.bool       (false,     '■ Alert On/Off'                , group   = 'Display')
i_channelOn  = input.bool       (false,     '■ Channel Range On/Off'        , tooltip = 'If the price (close) is over than the channel, the trend is bullish. If the price is under, bearish. And if the price is in the channel, it is in range', group   = 'Display')
i_goldenOn   = input.bool       (false,     '■ Golden Cross On/Off'         )
o_alert      =                              '{{strategy.order.comment}}'
i_alert      = input.string     (o_alert,   'Setting alert'                 , tooltip = 'For Alerts, just copy {{strategy.order.comment}} and paste in alert window.', group   = 'Display')

// ---------   Calculations
maFast1      = ta.ema(i_maSrc, i_maFast1)
maFast2      = ta.ema(i_maSrc, i_maFast2)
maDir        = maFast1 > maFast2 ? 1 : -1
maTrend      = request.security(syminfo.tickerid, i_htf,
               i_maLenSel == "SMA" ? ta.sma(close, i_maLen)[1] : ta.ema(close, i_maLen)[1],
               lookahead = barmerge.lookahead_on)  //No repaint
maTrendDir   = i_maSrc >= maTrend ? 1 : -1
rangeAtr     = ta.atr(i_maLen) * i_rangeLen
rangeTop     = maTrend + rangeAtr
rangeBot     = maTrend - rangeAtr
rangeCh      = (open <= rangeTop or close <= rangeTop) and
               (open >= rangeBot or close >= rangeBot)
trendDir     = i_typeS  ==  'Strategy 1'                            ?
               rangeCh                                                ?  0 :
               maTrendDir ==  1 and maDir ==  1 and maTrend > maFast2 ?  0 :
               maTrendDir == -1 and maDir == -1 and maTrend < maFast2 ?  0 :
               maTrendDir ==  1 and maDir ==  1                       ?  1 :
               maTrendDir == -1 and maDir == -1                       ? -1 : 0 :
               rangeCh                                                ?  0 :
               maTrendDir ==  1 and maDir ==  1                       ?  1 :
               maTrendDir == -1 and maDir == -1                       ? -1 : 0
GCross       = i_goldenOn ? ta.crossover (maFast2, maTrend) : na
DCross       = i_goldenOn ? ta.crossunder(maFast2, maTrend) : na

period       = true
// Set initial values
condition    = 0.0
entryLong    = trendDir ==  1 and
               i_posSel != 'Only Short' and
               (i_periodSw ? period : true)
entryShort   = trendDir == -1 and
               i_posSel != 'Only Long' and
               (i_periodSw ? period : true)
exitLong     = (trendDir !=  1 or maDir == -1) and
               condition[1] == 1 and 
               i_posSel != 'Only Short' and
               (i_periodSw ? period : true)
exitShort    = (trendDir != -1 or maDir ==  1) and
               condition[1] == -1 and
               i_posSel != 'Only Long' and
               (i_periodSw ? period : true)
closeCond    = exitLong or exitShort
// Stop Loss (sl)
slEntry      = close * i_sl / 100
slTop        = close + slEntry
slBot        = close - slEntry
slTopBuff    = ta.valuewhen(condition[1] !=  1 and entryLong,  slBot, 0)
slBotBuff    = ta.valuewhen(condition[1] != -1 and entryShort, slTop, 0)
slLine       = condition[1] == -1 and entryLong  ? slTopBuff :
               condition[1] ==  1 and entryShort ? slBotBuff :
               condition[1] ==  1  or entryLong  ? slTopBuff :
               condition[1] == -1  or entryShort ? slBotBuff : na
slTopCross   = condition[1] ==  1 and ta.crossunder(close, slLine) or high > slLine and low < slLine
slBotCross   = condition[1] == -1 and ta.crossover (close, slLine) or high > slLine and low < slLine
slExit       = i_slOn ? slTopCross or slBotCross : na
// Conditions
condition   := condition[1] !=  1 and entryLong  ?  1 :
               condition[1] != -1 and entryShort ? -1 :
               condition[1] !=  0 and slExit     ?  0 :
               condition[1] !=  0 and exitLong   ?  0 :
               condition[1] !=  0 and exitShort  ?  0 : nz(condition[1])
long         = condition[1] !=  1 and condition ==  1
short        = condition[1] != -1 and condition == -1
xl           = condition[1] ==  1 and exitLong and not slExit
xs           = condition[1] == -1 and exitShort and not slExit
sl           = condition[1] !=  0 and slExit

// ---------   Colors
c_green      = #006400  //Green
c_greenLight = #388e3c  //Green Light
c_red        = #8B0000  //Red
c_redLight   = #b71c1c  //Red Light
c_emas       = xl                             ? color.new(color.orange, 99) :
               xs                             ? color.new(color.orange, 99) :
               trendDir ==  1 and maDir ==  1 ? color.new(c_green,      99) :
               trendDir == -1 and maDir == -1 ? color.new(c_red,        99) :
               color.new(color.orange, 99)
c_maFill     = xl                             ? color.new(color.orange, 70) :
               xs                             ? color.new(color.orange, 70) :
               trendDir ==  1 and maDir ==  1 ? color.new(c_green,      70) :
               trendDir == -1 and maDir == -1 ? color.new(c_red,        70) :
               color.new(color.orange, 70)
c_maTrend    = trendDir ==  0                           ? color.new(color.orange,  0) :
               trendDir ==  1 and maTrend[1]  < maTrend ? color.new(c_green,       0) :
               trendDir ==  1 and maTrend[1] >= maTrend ? color.new(c_greenLight,  0) :
               trendDir == -1 and maTrend[1]  < maTrend ? color.new(c_redLight,    0) :
               trendDir == -1 and maTrend[1] >= maTrend ? color.new(c_red,         0) : na
c_ch         = trendDir ==  0                           ? color.new(color.orange, 50) :
               trendDir ==  1                           ? color.new(c_green,      50) :
               trendDir == -1                           ? color.new(c_red,        50) : na
c_slLineUp   = ta.rising (slLine, 1)
c_slLineDn   = ta.falling(slLine, 1)
c_slLine     = c_slLineUp ? na :
               c_slLineDn ? na : color.red
c_barCol     = trendDir ==  0                   ? color.new(color.orange,  0) :
               trendDir ==  1 and open <= close ? color.new(c_green,       0) :
               trendDir ==  1 and open  > close ? color.new(c_greenLight,  0) :
               trendDir == -1 and open >= close ? color.new(c_red,         0) :
               trendDir == -1 and open  < close ? color.new(c_redLight,    0) :
               color.new(color.orange, 0)

// ---------   Plots
p_maFast1    = plot(
  maFast1,
  title      = 'EMA Fast 1',
  color      = c_emas,
  linewidth  = 1)
p_maFast2    = plot(
  maFast2,
  title      = 'EMA Fast 2',
  color      = c_emas,
  linewidth  = 2)
fill(
  p_maFast1, p_maFast2,
  title      = 'EMAs Fill',
  color      = c_maFill)
plot(
  maTrend,
  title      = 'SMA Trend',
  color      = c_maTrend,
  linewidth  = 3)
p_chTop      = plot(
  i_channelOn   ? rangeTop : na,
  title      = 'Top Channel',
  color      = c_maTrend,
  linewidth  = 1)
p_chBot      = plot(
  i_channelOn   ? rangeBot : na,
  title      = 'Bottom Channel',
  color      = c_maTrend,
  linewidth  = 1)
fill(
  p_chTop, p_chBot,
  title      = 'Channel',
  color      = c_ch)
plot(
  i_slOn and condition != 0 ? slLine : na,
  title      = 'Stop Loss Line',
  color      = c_slLine,
  linewidth  = 1,
  style      = plot.style_linebr)

// ---------   Alerts
barcolor(i_barColOn ? c_barCol : na)

plotshape(
  i_alertOn and long ? high : na,
  title      = 'Long Label',
  text       = 'Long',
  textcolor  = color.white,
  color      = color.new(c_green, 0),
  style      = shape.labelup,
  size       = size.normal,
  location   = location.belowbar)
plotshape(
  i_alertOn and short ? low : na,
  title      = 'Short Label',
  text       = 'Short',
  textcolor  = color.white,
  color      = color.new(c_red, 0),
  style      = shape.labeldown,
  size       = size.normal,
  location   = location.abovebar)
plotshape(
  i_alertOn and (xl or xs) ? close : na,
  title      = 'Close Label',
  text       = 'Close',
  textcolor  = color.orange,
  color      = color.new(color.orange, 0),
  style      = shape.xcross,
  size       = size.small,
  location   = location.absolute)
plotshape(
  i_alertOn and sl ? slLine : na,
  title      = 'Stop Loss',
  text       = 'Stop\nLoss',
  textcolor  = color.orange,
  color      = color.new(color.orange, 0),
  style      = shape.xcross,
  size       = size.small,
  location   = location.absolute)
plotshape(
  i_alertOn and i_goldenOn and GCross ? maTrend : na,
  title      = 'Golden Cross Label',
  text       = 'Golden\nCross',
  textcolor  = color.white,
  color      = color.new(color.orange, 0),
  style      = shape.labelup,
  size       = size.normal,
  location   = location.absolute)
plotshape(
  i_alertOn and i_goldenOn and DCross ? maTrend : na,
  title      = 'Death Cross Label',
  text       = 'Death\nCross',
  textcolor  = color.white,
  color      = color.new(color.orange, 0),
  style      = shape.labeldown,
  size       = size.normal,
  location   = location.absolute)

bgcolor(
  i_periodSw and not period ? color.new(color.gray, 90) : na,
  title      = 'Session')

// ---------   Backtest
if long  and strategy.position_size == 0 and barstate.isconfirmed
    strategy.entry('Long',  strategy.long,  comment = 'long')
if short and strategy.position_size == 0 and barstate.isconfirmed
    strategy.entry('Short', strategy.short, comment = 'short')
strategy.exit(
  id         = 'XL',
  from_entry = 'Long',
  stop       = i_slOn ? slLine : na)
strategy.exit(
  id         = 'XS',
  from_entry = 'Short',
  stop       = i_slOn ? slLine : na)
strategy.close(
  'Long',
  comment    = 'Close',
  when       = xl)
strategy.close(
  'Short',
  comment    = 'Close',
  when = xs)