더블 추적 손절매 터틀 트레이딩 전략

개요
이 전략은 터틀 트레이딩 규칙을 활용하여 두 개의 후행 손절점(trailing stop loss)을 설정합니다. 이중 후행 손절을 통해 손실을 제한하고, 서로 다른 파라미터를 설정하여 시장 노이즈를 걸러내며, 추세가 뚜렷할 때 매수에 진입합니다.
전략 원리
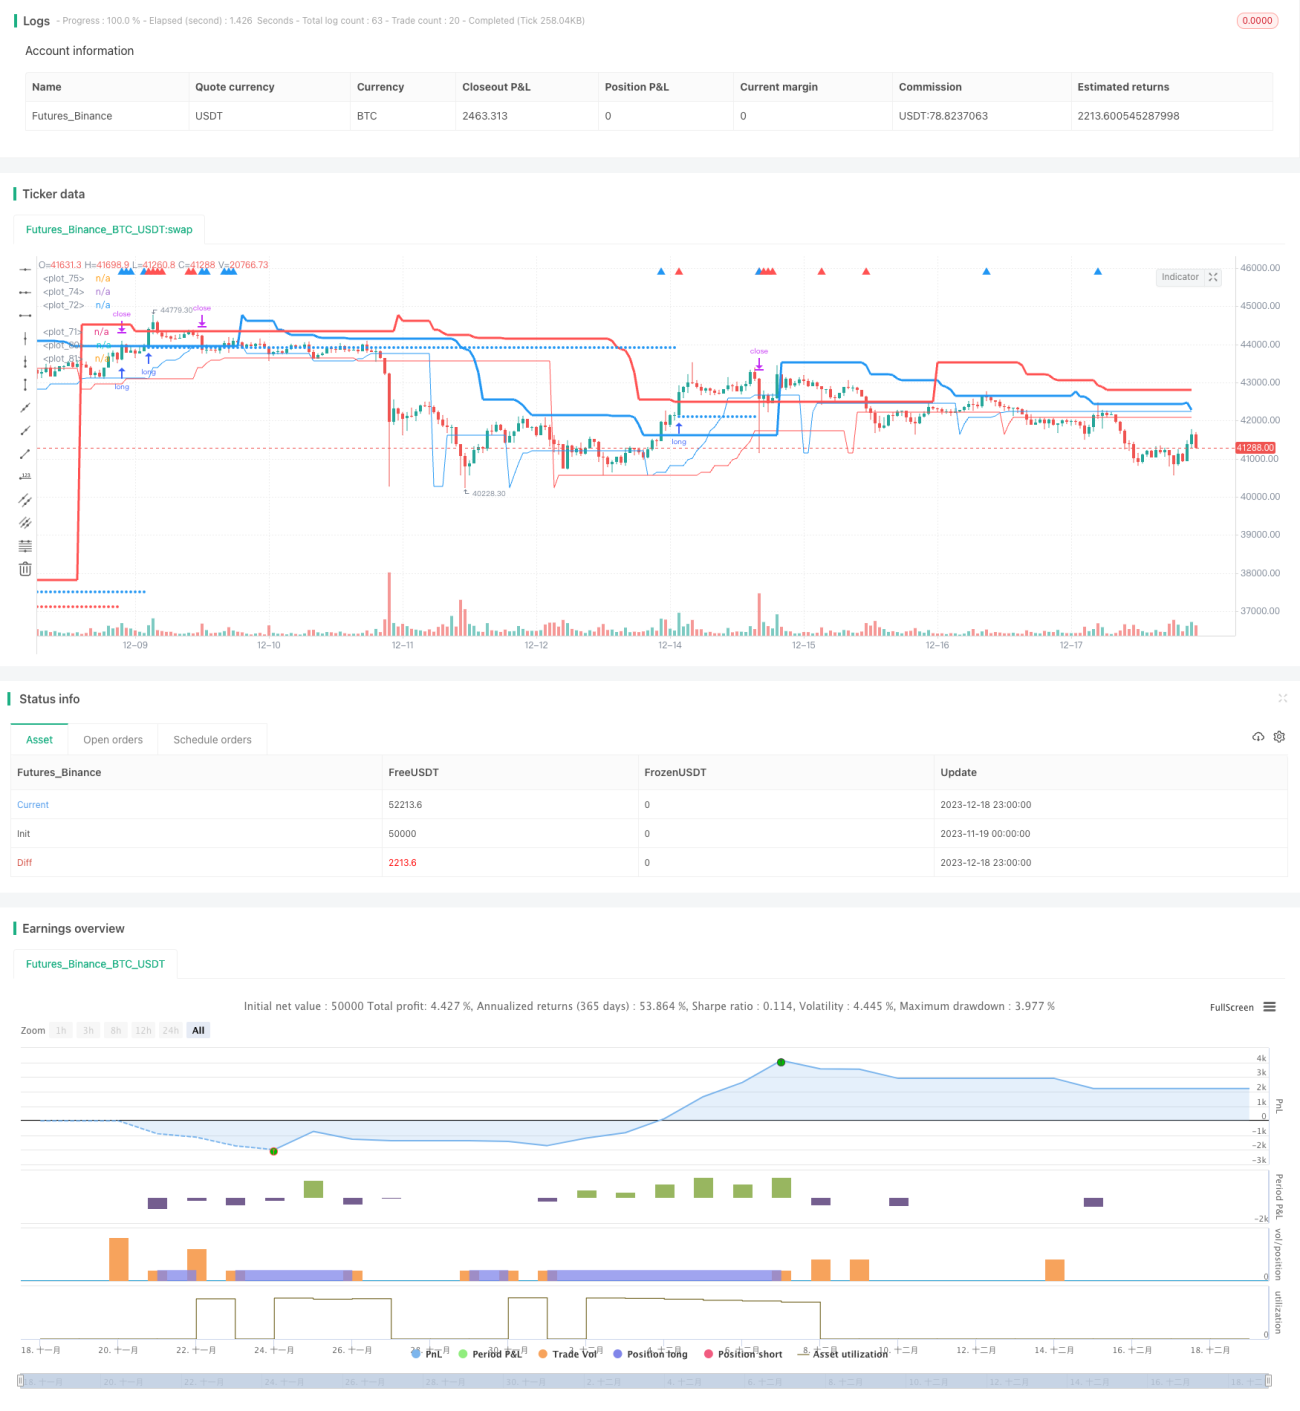
이 전략은 주로 두 개의 후행 손절점 long_1과 long_2를 통해 매수 시점을 결정합니다. long_1은 장기 추세를 추적하고, long_2는 단기 추세를 추적합니다. 또한 profit1과 profit2를 손절점으로 설정합니다.
가격이 long_1보다 높으면 시장이 장기 상승 추세에 있는 것입니다. 이때 가격이 long_2보다 낮아지면 단기 조정이 발생하여 좋은 진입 기회를 제공하므로 매수 포지션을 진입합니다. 가격이 long_1보다 낮으면 장기 추세가 명확하지 않은 상태에서 단기적으로 가격이 long_2보다 높으면 단기 반등이 발생한 것으로 판단하여 역시 진입할 수 있습니다.
진입 후에는 두 개의 후행 손절점 stoploss1과 stoploss2를 설정하고, profit1, profit2와 비교하여 최댓값을 취함으로써 이익을 고정시킵니다.
장점 분석
- 이중 후행 손절을 통해 리스크를 효과적으로 통제하고 이익을 최대한 고정할 수 있습니다.
- 장기 및 단기 지표를 결합하여 일부 노이즈를 걸러내고 비교적 명확한 추세에서 진입할 수 있습니다.
- 파라미터 조정을 통해 전략의 보수성을 자유롭게 제어할 수 있습니다.
리스크 분석
- 전략이 비교적 보수적이어서 일부 기회를 놓칠 수 있습니다.
- 손절점 설정이 부적절하면 조기에 손절될 수 있습니다.
- 거래 횟수가 적어 단일 손실 폭이 클 수 있습니다.
long과 profit의 파라미터를 적절히 조정하면 전략을 더 공격적으로 만들어 거래 횟수를 늘릴 수 있습니다. 또한 손절점 알고리즘을 최적화하여 자동 조정이 가능하게 할 수 있습니다.
최적화 방향
- long과 profit의 파라미터를 최적화하여 최적의 파라미터 조합을 찾습니다.
- 지그재그 손절 또는 그림자 손절 알고리즘을 시도하여 불필요한 손절을 줄입니다.
- 진입 조건을 추가하여 노이즈를 걸러내고 더 명확한 추세를 찾습니다.
- 거래량 지표를 결합하여 진정한 돌파를 찾습니다.
요약
이 전략은 전반적으로 비교적 보수적이며 안정적인 성장을 추구하는 투자자에게 적합합니다. 파라미터 조정과 손절 알고리즘 최적화를 통해 전략의 공격성을 적절히 높일 수 있습니다. 또한 시장 노이즈를 필터링하는 메커니즘을 추가하는 것도 향후 최적화 방향 중 하나입니다.
- 1