모멘텀 지표 반전 거래 전략

1
Follow
1778
Followers
개요
이 전략은 동력 지표에 기반한 역전 거래 전략이다. 그것은 시장의 움직임을 판단하기 위해 유동성 지표 ((EOM) 를 사용하며, 지표가 설정된 하락치를 초과할 때 더 많은 공백을 한다. 동시에 역전 거래 기능을 제공하며, 실제 필요에 따라 직전 거래 또는 역전 거래를 선택할 수 있다.
전략 원칙
유동성 지표 (EOM) 는 가격과 거래량 변화의 정도를 측정하는 지표이다. 이 지표는 동시에 양과 음의 값을 반환한다. 양값은 가격 상승을 나타내고, 음값은 가격 하락을 나타낸다. 수치가 클수록 가격 변화가 더 크고/또는 거래량이 더 작다는 것을 의미한다.
이 전략은 다음과 같습니다.
- 현재 K 선의 이동 지표 값을 계산합니다.
- 지표값이 설정된 적립치 또는 적립치보다 높지 않은지 판단하기
- 만약 더 많은 <unk>값을 <unk>다면 (기본 4000) 더 많은 <unk>값을 <unk>다면
- 만약 공백값이 << (기본-4000) 이면 공백합니다.
- 역거래 기능을 제공합니다.
- 보통의 상황에서는 더 많이 할 때 시가 상승, 더 많이 할 때 시가 하락
- 반전 거래가 시작되고, 더 많이 하락하고, 더 많이 하락하고, 더 많이 하락합니다.
우위 분석
이 전략의 주요 장점은 다음과 같습니다.
- 시장의 실제 움직임을 판단하기 위해 유동성 지표를 사용하며, 지표는 가격과 거래량 변화를 반영합니다.
- <unk>값을 사용자 정의할 수 있습니다.
- 역거래 기능을 제공하여 필요에 따라 직전 거래 또는 역거래를 선택할 수 있습니다.
- 직관적으로 K선 색을 통해 더 많은 공백을 만듭니다.
위험 분석
이 전략의 주요 위험은 다음과 같습니다.
- 유통 지표의 실수 위험, 가짜 돌파의 위험
- 부적절한 스레드 설정으로 인해 거래가 너무 자주 또는 적게 이루어질 수 있습니다.
- 리버스 거래는 충분한 위험을 감수할 수 있는지 확인해야 합니다.
해결책:
- 다른 지표와 함께 판단하여 오류를 방지하십시오.
- 하락 변수를 조정하고 거래 수를 최적화합니다.
- 실제 위험을 감수할 수 있는 능력을 제대로 평가하는 것
최적화 방향
이 전략은 다음과 같은 방향으로 최적화될 수 있습니다.
- 이동 평균과 같은 지표와 함께 가짜 돌파구를 피하십시오.
- 손해 방지 장치 추가
- 최적화 변수, 더 많은 공백을 조정하는 <unk>값
- 포지션 개시 조건을 늘리고, 거래 빈도를 줄여라
- 리스커스 트레이딩에 대해 설정할 수 있는 위험 관리 전략
위와 같은 몇 가지 최적화를 통해 전략이 더 안정적이고, 위험을 줄이고, 실전 효과를 높일 수 있다.
요약하다
전체적으로 이 전략은 시장의 실제 움직임을 판단하기 위해 유동적 인 지표를 사용하여 과잉과 적자를 통해 초과 수익을 얻습니다. 그것은 간단하고 사용하기 쉽고 가격 변화와 거래량 변화의 두 가지 요소를 고려합니다. 실장에 사용할 경우 다른 기술 지표와 결합하여 적절한 최적화 매개 변수를 사용하는 것이 좋습니다.
Source
Pine
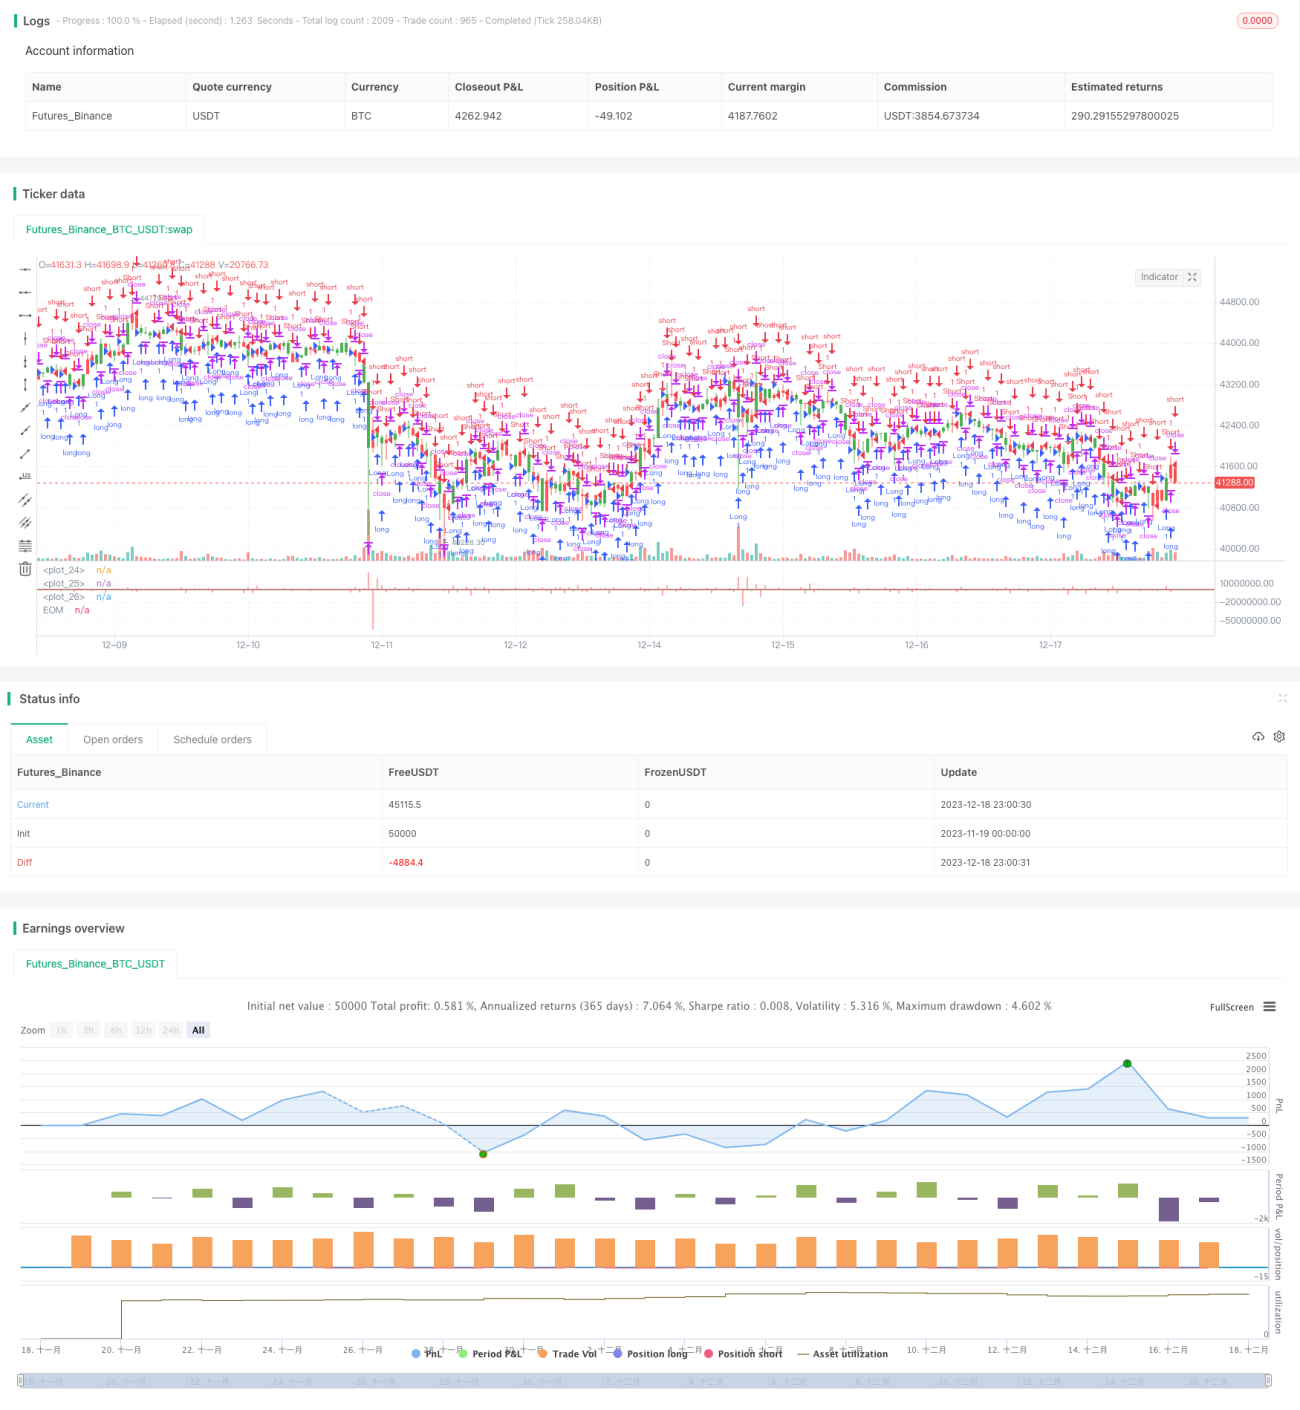
/*backtest
start: 2023-11-19 00:00:00
end: 2023-12-19 00:00:00
period: 1h
basePeriod: 15m
exchanges: [{"eid":"Futures_Binance","currency":"BTC_USDT"}]
*/

//@version=2
////////////////////////////////////////////////////////////
//  Copyright by HPotter v1.0 19/06/2018
// This indicator gauges the magnitude of price and volume movement. Strategy parameters
Related strategies
Comment
All comments (0)
No data
- 1