EMA 이동평균선 교차를 기반으로 한 트레일링 스톱 전략

1
Follow
1778
Followers
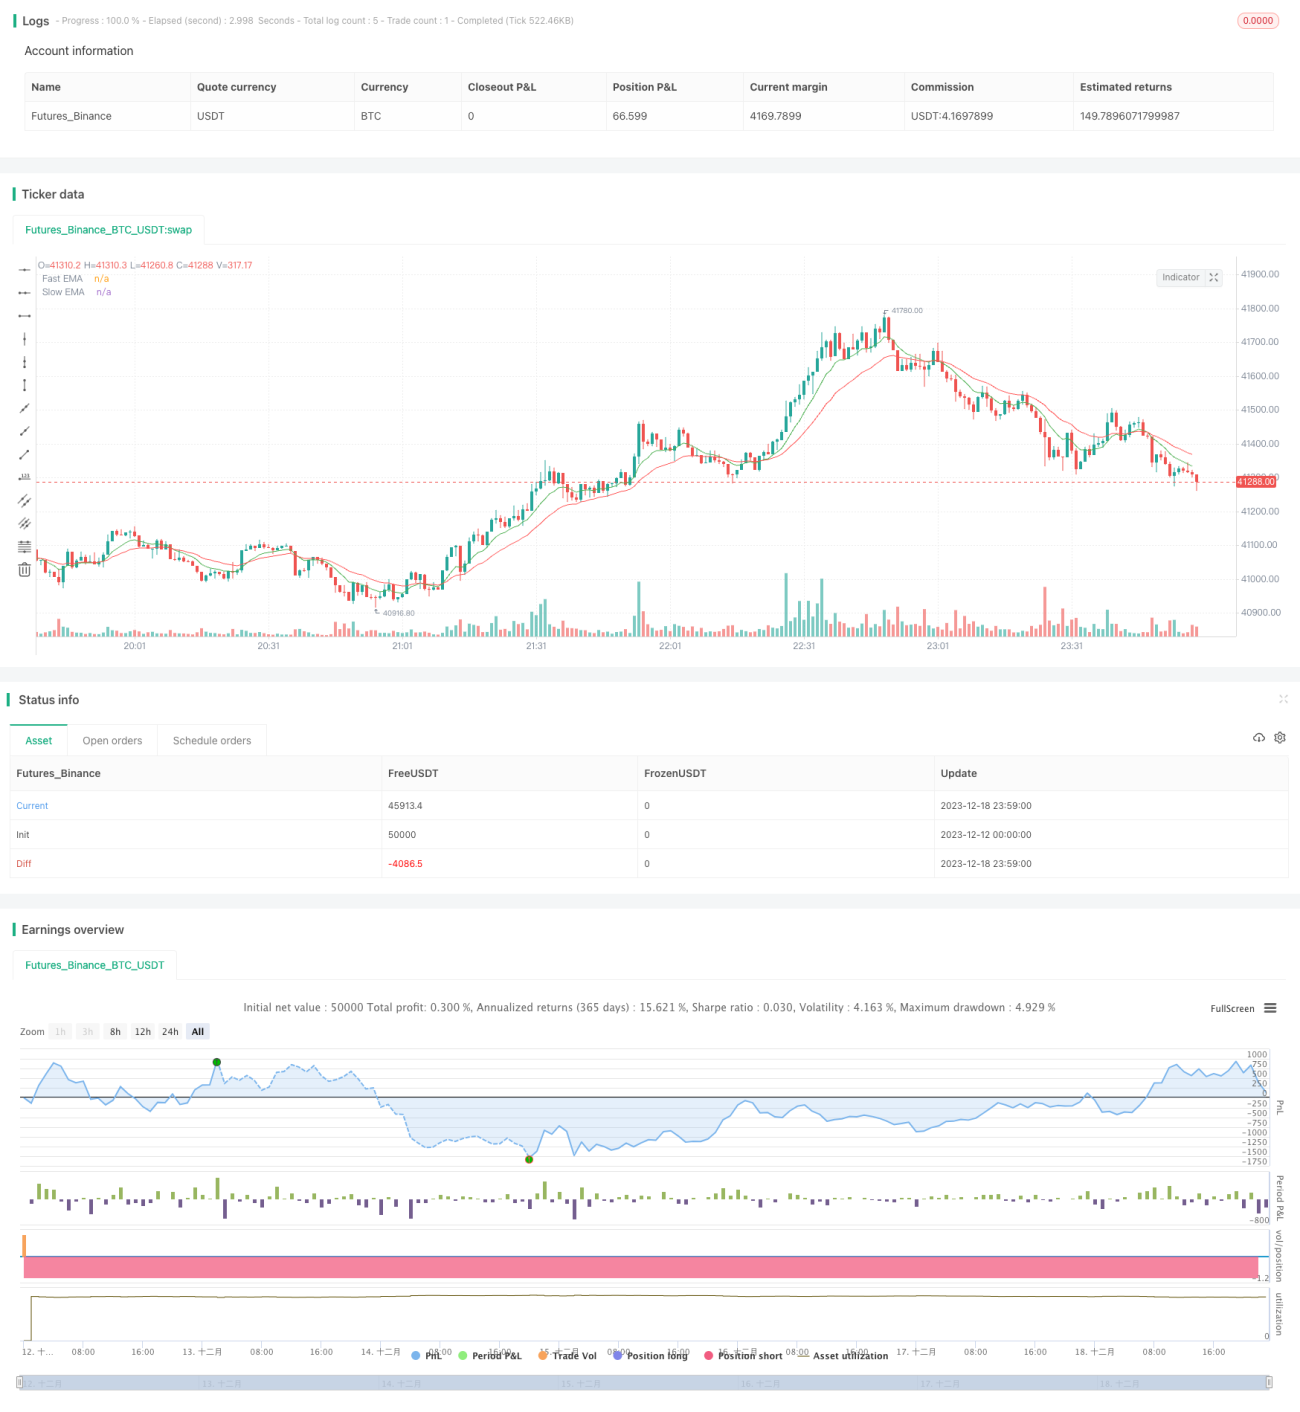
개요
이 전략은 빠른 EMA 평균선 ((9주기) 과 느린 EMA 평균선 ((21주기) 의 교차를 입문 신호로 사용하고, 이동한 스톱로스를 결합하여 이익을 잠금화하여 과대 인출을 피한다.
전략 원칙
빠른 EMA 라인이 아래쪽에서 느린 EMA 라인을 뚫을 때, 구매 신호를 생성한다. 빠른 EMA 라인이 위쪽에서 아래쪽에서 느린 EMA 라인을 뚫을 때, 판매 신호를 생성한다.
일단 입시되면, 전략은 실시간으로 최고 가격을 추적하고, 현재 최고 가격보다 2% 낮으면 이동식 스톱로스를 트리거하여 수익을 잠금합니다.
우위 분석
- EMA 평균선의 트렌드 추적 및 신호 생성 능력을 활용하여 중장선 트렌드를 효과적으로 포착할 수 있습니다.
- 이동식 중지 메커니즘은 수익의 대부분을 고정시켜 모든 수익을 삼키지 못하게 합니다.
- EMA 평균선 변수는 조정 가능하며, 다양한 시장 환경에 적응할 수 있습니다.
- 구매/판매 신호 규칙이 명확하고 쉽게 적용됩니다.
위험 분석
- EMA 평균이 지연되어 단선 기회를 놓칠 수 있습니다.
- 이동식 정지 거리가 잘못 설정되어 조기 정지되거나 무효가 될 수 있습니다.
- 매개 변수가 시장 환경에 맞지 않아 거래 빈도 또는 신호 부족이 발생할 수 있습니다.
위험 해결 방법:
- 적절한 EMA 변수 조합을 선택합니다.
- 테스트 및 평가 스톱 거리 변수
- 시장의 변동에 대응하는 변수 조정
최적화 방향
- 시장의 변동성과 위험 선호도에 따라 이동식 중지 거리를 동적으로 조정합니다.
- 가짜 신호를 줄이기 위해 다른 지표 필터를 추가합니다.
- EMA 평균선 주기 변수를 최적화하는 선택
- 트렌드 지표와 함께 큰 트렌드를 파악하고 반-트렌드 거래를 피하십시오.
요약하다
이 전략은 트렌드 판단과 손해 관리의 장점을 통합하여 순차적으로 수행 할 수 있으며 위험을 효과적으로 제어 할 수 있습니다. 매개 변수를 조정하고 최적화하여 다양한 유형의 시장과 거래 품종에 적용 할 수 있으며 더 많은 테스트를 할 가치가 있습니다.
Source
Pine
Related strategies
Comment
All comments (0)
No data
- 1