개요
이 전략은 두 개의 유명한 지표: MACD와 상대 강도 ((RS) 를 기반으로 한다. 그것들을 결합함으로써 우리는 강력한 구매 신호를 얻는다. 실제로 이 전략의 특이점은 한 지표에서 다른 지표를 도출한다는 것이다. 따라서 우리는 구매 신호만을 고려하고 판매 신호를 무시하는 전략이 RS의 가치를 기반으로 한다.
전략 원칙
RS는 동력을 측정하는 것과 시장의 효율성 가설 사이의 비정상적인 지표이다. 전문가가 사용하는 가장 안정적인 지표 중 하나입니다. 그 아이디어는 과거의 성과에 따라 평균보다 우수한 성능을 보이는 자산을 보유하는 것입니다. 우리는 다음과 같은 수식을 사용하여 RS를 계산합니다.
RS = 현재 가격 / RS 길이의 최고 가격
따라서, 우리는 현재 가격을 사용자 정의된 기간의 최고 가격과 비교할 수 있습니다.
MACD는 가장 유명한 지표 중 하나이며, 두 개의 지수 이동 평균 사이의 거리를 측정합니다. 빠른 라인과 느린 라인. 거리가 넓을수록 운동량이 더 크다는 것을 나타냅니다.
주의할 점은, 처음 두 개의 이동 평균은 RS 값을 소스로 사용하여 구성되었다는 것입니다. 그래서, 우리는 방금 한 지표에서 다른 지표를 구축했습니다. 이 방법은 매우 강력합니다, 왜냐하면 그것은 거의 사용되지 않기 때문에 전략에 가치를 제공합니다.
우위 분석
이 전략은 MACD와 RS를 결합합니다. MACD는 단기 트렌드 및 동력의 변화를 포착 할 수 있으며, RS는 중장기 트렌드의 강도를 반영합니다. 단기 요소와 장기 요소를 모두 고려하여 구매 신호를 더 신뢰할 수 있도록 결합합니다.
또한, 이 전략은 RS 지표에서 MACD 지표를 도출함으로써 전략의 효과를 창의적으로 향상시키는 매우 독특한 방법입니다. 이러한 혁신적인 디자인은 거의 사람들이하지 않기 때문에 추가 수익을 가져올 가능성이 높습니다.
마지막으로, 전략은 자금 관리와 손실을 막는 메커니즘을 가지고 있으며, 개별 거래의 손실을 제한하여 위험을 효과적으로 제어 할 수 있습니다.
위험 분석
이 전략의 가장 큰 위험은 RS와 MACD 지표가 잘못된 신호를 발산할 가능성이 있다. 이 두 지표는 모두 안정적이긴 하지만, 어떤 기술 지표도 100% 미래를 예측할 수 없으며, 신호는 때때로 실패할 수 있다. 또한, RS 지표는 자체적으로 중장기 경향 판단에 더 많은 편향을 가지고 있으며, 단기간에 잘못된 신호가 발생할 수 있다.
위험을 줄이기 위해 RS와 MACD의 파라미터를 적절히 조정하여 특정 거래 유형과 시장 환경에 더 적합하게 할 수 있습니다. 또한 더 엄격한 중지 손실을 설정할 수 있습니다. 일반적으로 단편 손실을 제어하기 위해 중지 손실을 사용하는 것이 전략의 위험에 대응하는 가장 좋은 방법입니다.
최적화 방향
첫째, 다양한 시장 (주식, 외환, 암호화폐 등) 에서 어떤 품종이 가장 잘 작동하는지 테스트하고, 그 다음에는 가장 좋은 품종에 집중할 수 있습니다.
두 번째, RS와 MACD 변수를 자동으로 최적화하기 위해 기계 학습 알고리즘을 사용할 수 있습니다. 이는 변수의 적응성을 크게 향상시킬 수 있습니다.
세 번째, 거래 신호를 만드는 데 참여하는 다른 지표를 추가하여 다중 인자 모델을 형성하고 신호의 정확성을 향상시킬 수 있습니다. 예를 들어 거래량 지표를 추가하는 등.
요약하다
이 전략은 MACD와 RS 두 지표를 통합하여 강력한 구매 신호를 제공합니다. 이 전략의 혁신은 RS 지표에서 MACD 지표를 파생하여 지표와 지표를 결합하여 효과를 높이는 것입니다. 이 전략에는 명확한 입점, 손실 및 자금 관리 장치가 있으며 위험을 효과적으로 제어 할 수 있습니다. 다음 단계는 매개 변수를 최적화하고 신호 생성을 개선하고 다른 요소를 추가하여 전략을 더 개선 할 수 있습니다.
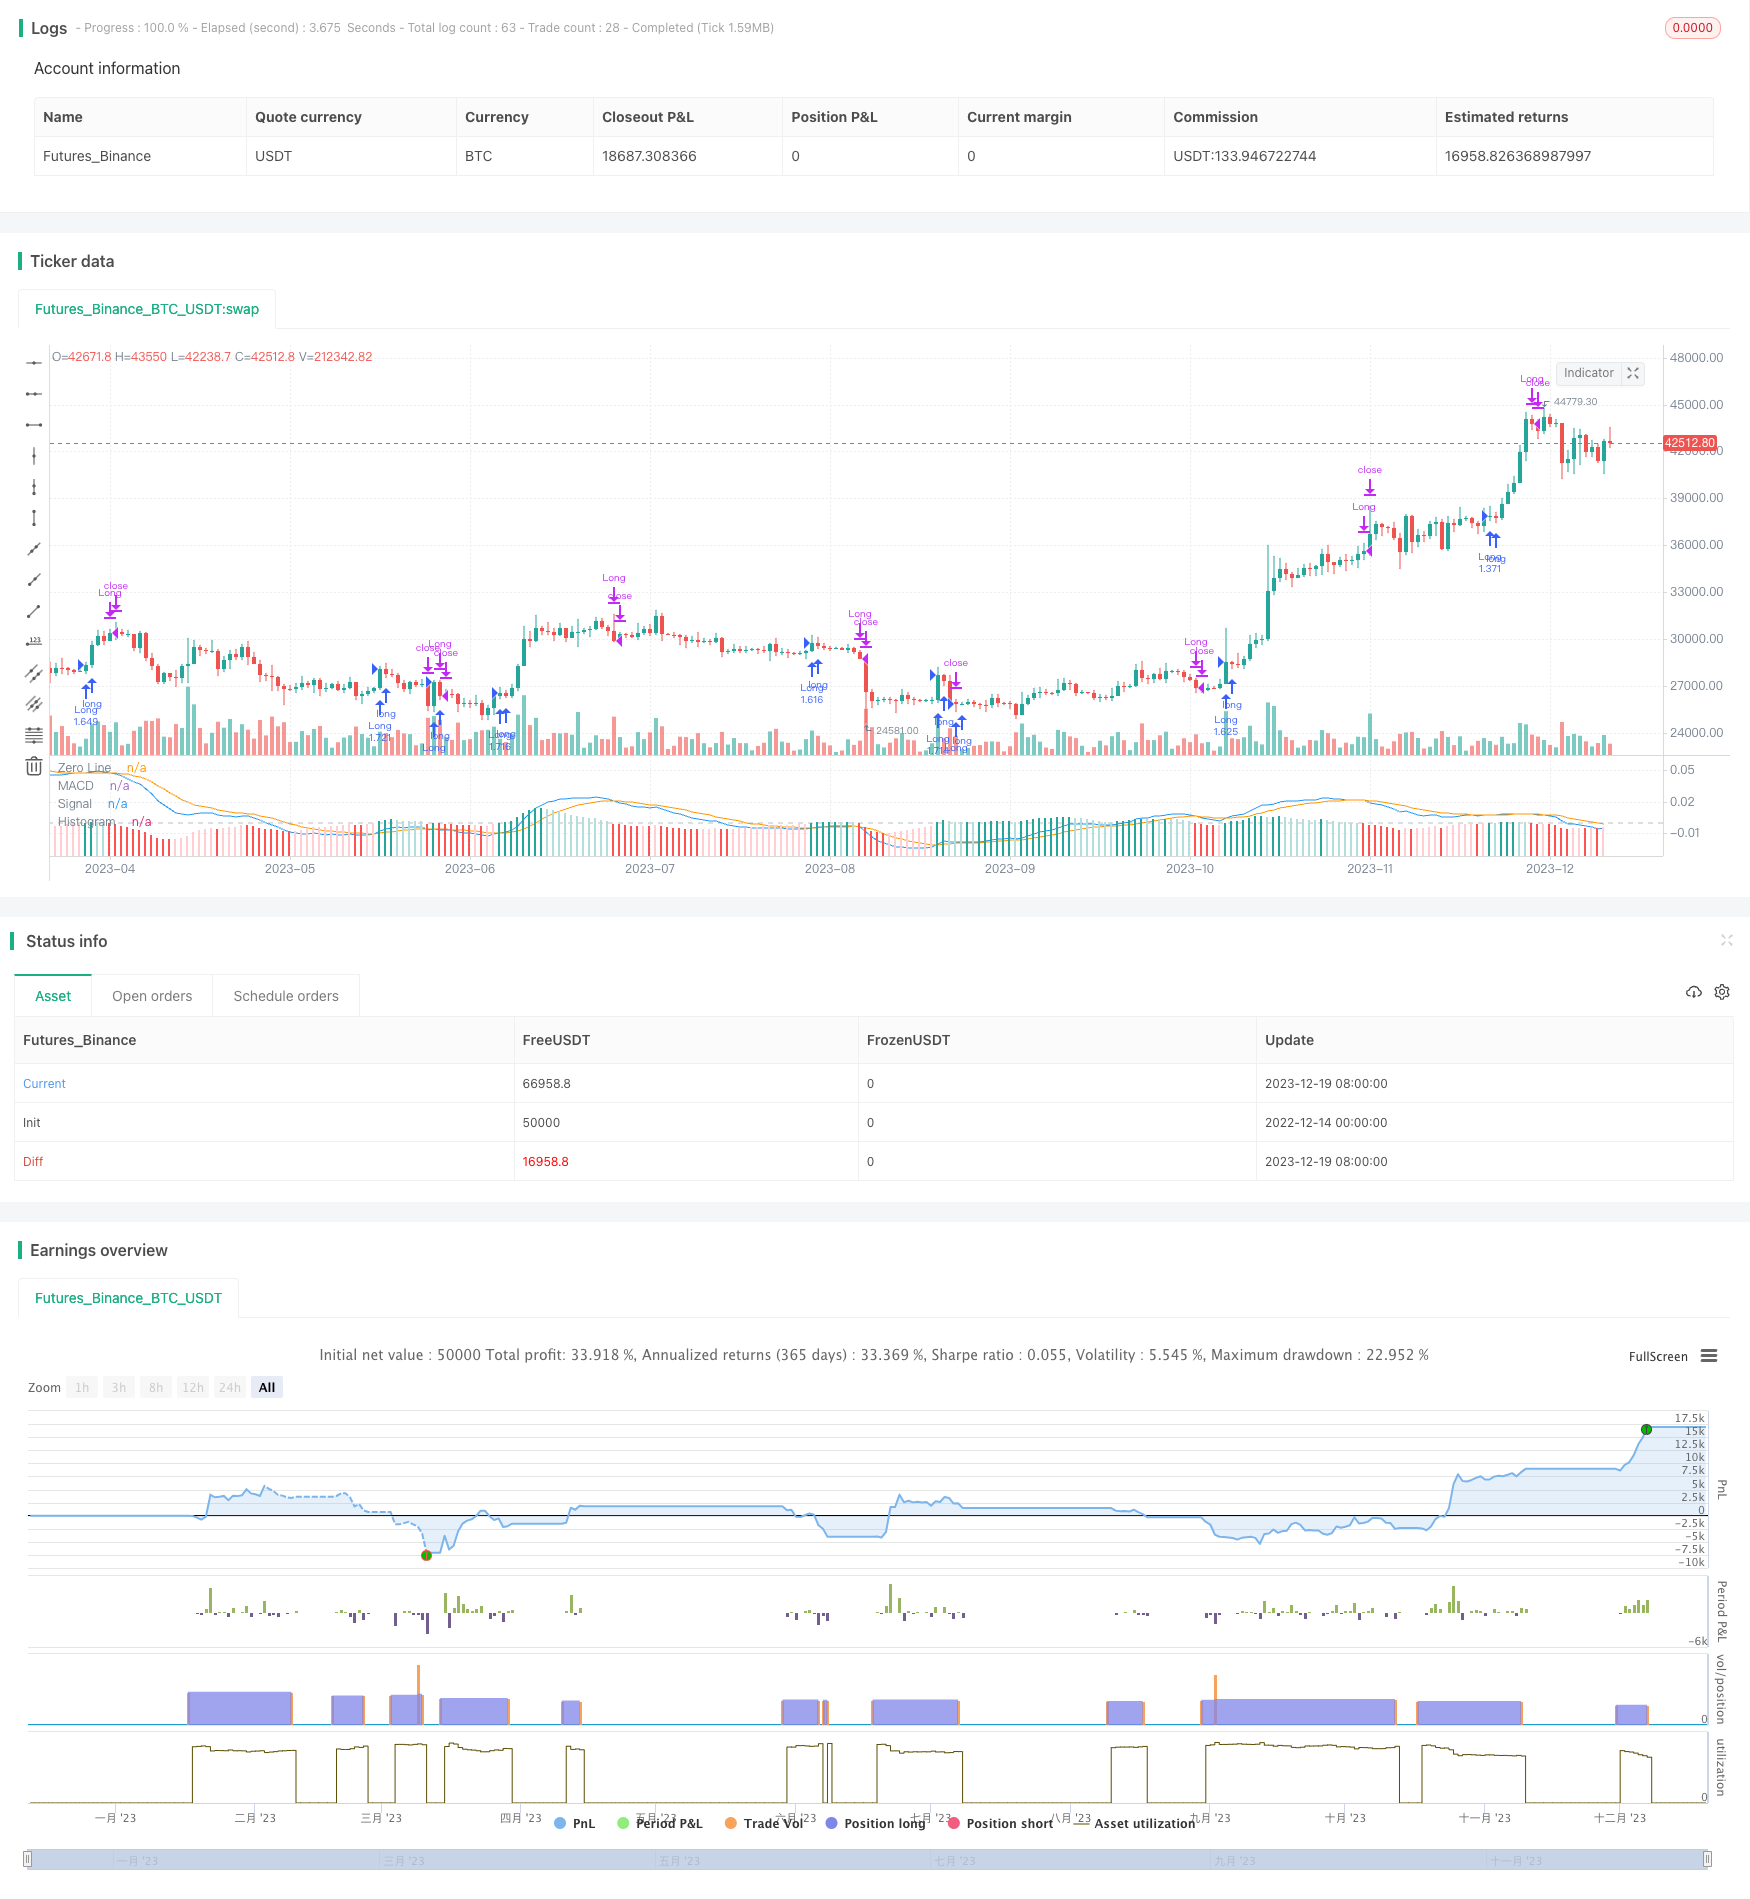
/*backtest
start: 2022-12-14 00:00:00
end: 2023-12-20 00:00:00
period: 1d
basePeriod: 1h
exchanges: [{"eid":"Futures_Binance","currency":"BTC_USDT"}]
*/

// This source code is subject to the terms of the Mozilla Public License 2.0 at https://mozilla.org/MPL/2.0/
// © gsanson66


//This strategy calculates the Relative Strength and plot the MACD of this Relative Strenght
//We take only buy signals send by MACD
//@version=5
strategy("MACD OF RELATIVE STRENGHT STRATEGY", shorttitle="MACD RS STRATEGY", precision=4, overlay=false, initial_capital=1000, default_qty_type=strategy.cash, default_qty_value=950, commission_type=strategy.commission.percent, commission_value=0.18, slippage=3)


//------------------------------TOOL TIPS--------------------------------//

t1 = "Relative Strength length i.e. number of candles back to find the highest high and compare the current price with this high."
t2 = "Relative Strength fast EMA length used to plot the MACD."
t3 = "Relative Strength slow EMA length used to plot the MACD."
t4 = "Macdline SMA length used to plot the MACD."
t5 = "The maximum loss a trade can incur (in percentage of the trade value)"
t6 = "Each gain or losse (relative to the previous reference) in an amount equal to this fixed ratio will change quantity of orders."
t7 = "The amount of money to be added to or subtracted from orders once the fixed ratio has been reached."


//----------------------------------------FUNCTIONS---------------------------------------//

//@function Displays text passed to `txt` when called.
debugLabel(txt, color, loc) =>
    label.new(bar_index, loc, text=txt, color=color, style=label.style_label_lower_right, textcolor=color.black, size=size.small)

//@function which looks if the close date of the current bar falls inside the date range
inBacktestPeriod(start, end) => (time >= start) and (time <= end)


//---------------------------------------USER INPUTS--------------------------------------//

//Technical parameters
rs_lenght = input.int(defval=300, minval=1, title="RS Length", group="Technical parameters", tooltip=t1)
fast_length = input(title="MACD Fast Length", defval=14, group="Technical parameters", tooltip=t2)
slow_length = input(title="MACD Slow Length", defval=26, group="Technical parameters", tooltip=t3)
signal_length = input.int(title="MACD Signal Smoothing",  minval=1, maxval=50, defval=10, group="Technical parameters", tooltip=t4)
//Risk Management
slMax = input.float(8, "Max risk per trade (in %)", minval=0, group="Risk Management", tooltip=t5)
//Money Management
fixedRatio = input.int(defval=400, minval=1, title="Fixed Ratio Value ($)", group="Money Management", tooltip=t6)
increasingOrderAmount = input.int(defval=200, minval=1, title="Increasing Order Amount ($)", group="Money Management", tooltip=t7)
//Backtesting period
startDate = input(title="Start Date", defval=timestamp("1 Jan 2020 00:00:00"), group="Backtesting Period")
endDate = input(title="End Date", defval=timestamp("1 July 2024 00:00:00"), group="Backtesting Period")


//----------------------------------VARIABLES INITIALISATION-----------------------------//
strategy.initial_capital = 50000
//Relative Strenght Calculation
rs = close/ta.highest(high, rs_lenght)
//MACD of RS Calculation
[macdLine, signalLine, histLine] = ta.macd(rs, fast_length, slow_length, signal_length)
//Money management
equity = math.abs(strategy.equity - strategy.openprofit)
var float capital_ref = strategy.initial_capital
var float cashOrder = strategy.initial_capital * 0.95
//Backtesting period
bool inRange = na


//------------------------------CHECKING SOME CONDITIONS ON EACH SCRIPT EXECUTION-------------------------------//

//Checking if the date belong to the range
inRange := true

//Checking performances of the strategy
if equity > capital_ref + fixedRatio
    spread = (equity - capital_ref)/fixedRatio
    nb_level = int(spread)
    increasingOrder = nb_level * increasingOrderAmount
    cashOrder := cashOrder + increasingOrder
    capital_ref := capital_ref + nb_level*fixedRatio
if equity < capital_ref - fixedRatio
    spread = (capital_ref - equity)/fixedRatio
    nb_level = int(spread)
    decreasingOrder = nb_level * increasingOrderAmount
    cashOrder := cashOrder - decreasingOrder
    capital_ref := capital_ref - nb_level*fixedRatio

//Checking if we close all trades in case where we exit the backtesting period
if strategy.position_size!=0 and not inRange
    strategy.close_all()
    debugLabel("END OF BACKTESTING PERIOD : we close the trade", color=color.rgb(116, 116, 116), loc=macdLine)


//-----------------------------------EXIT SIGNAL------------------------------//

if strategy.position_size>0 and histLine<0
    strategy.close("Long")


//-------------------------------BUY CONDITION-------------------------------------//

if histLine>0 and not (strategy.position_size>0) and inRange
    qty = cashOrder/close
    stopLoss = close*(1-slMax/100)
    strategy.entry("Long", strategy.long, qty)
    strategy.exit("Exit Long", "Long", stop=stopLoss)


//---------------------------------PLOTTING ELEMENT----------------------------------//

hline(0, "Zero Line", color=color.new(#787B86, 50))
plot(macdLine, title="MACD", color=color.blue)
plot(signalLine, title="Signal", color=color.orange)
plot(histLine, title="Histogram", style=plot.style_columns, color=(histLine>=0 ? (histLine[1] < histLine ? #26A69A : #B2DFDB) : (histLine[1] < histLine ? #FFCDD2 : #FF5252)))
plotchar(rs, "Relative Strenght", "", location.top, color=color.yellow)