개요
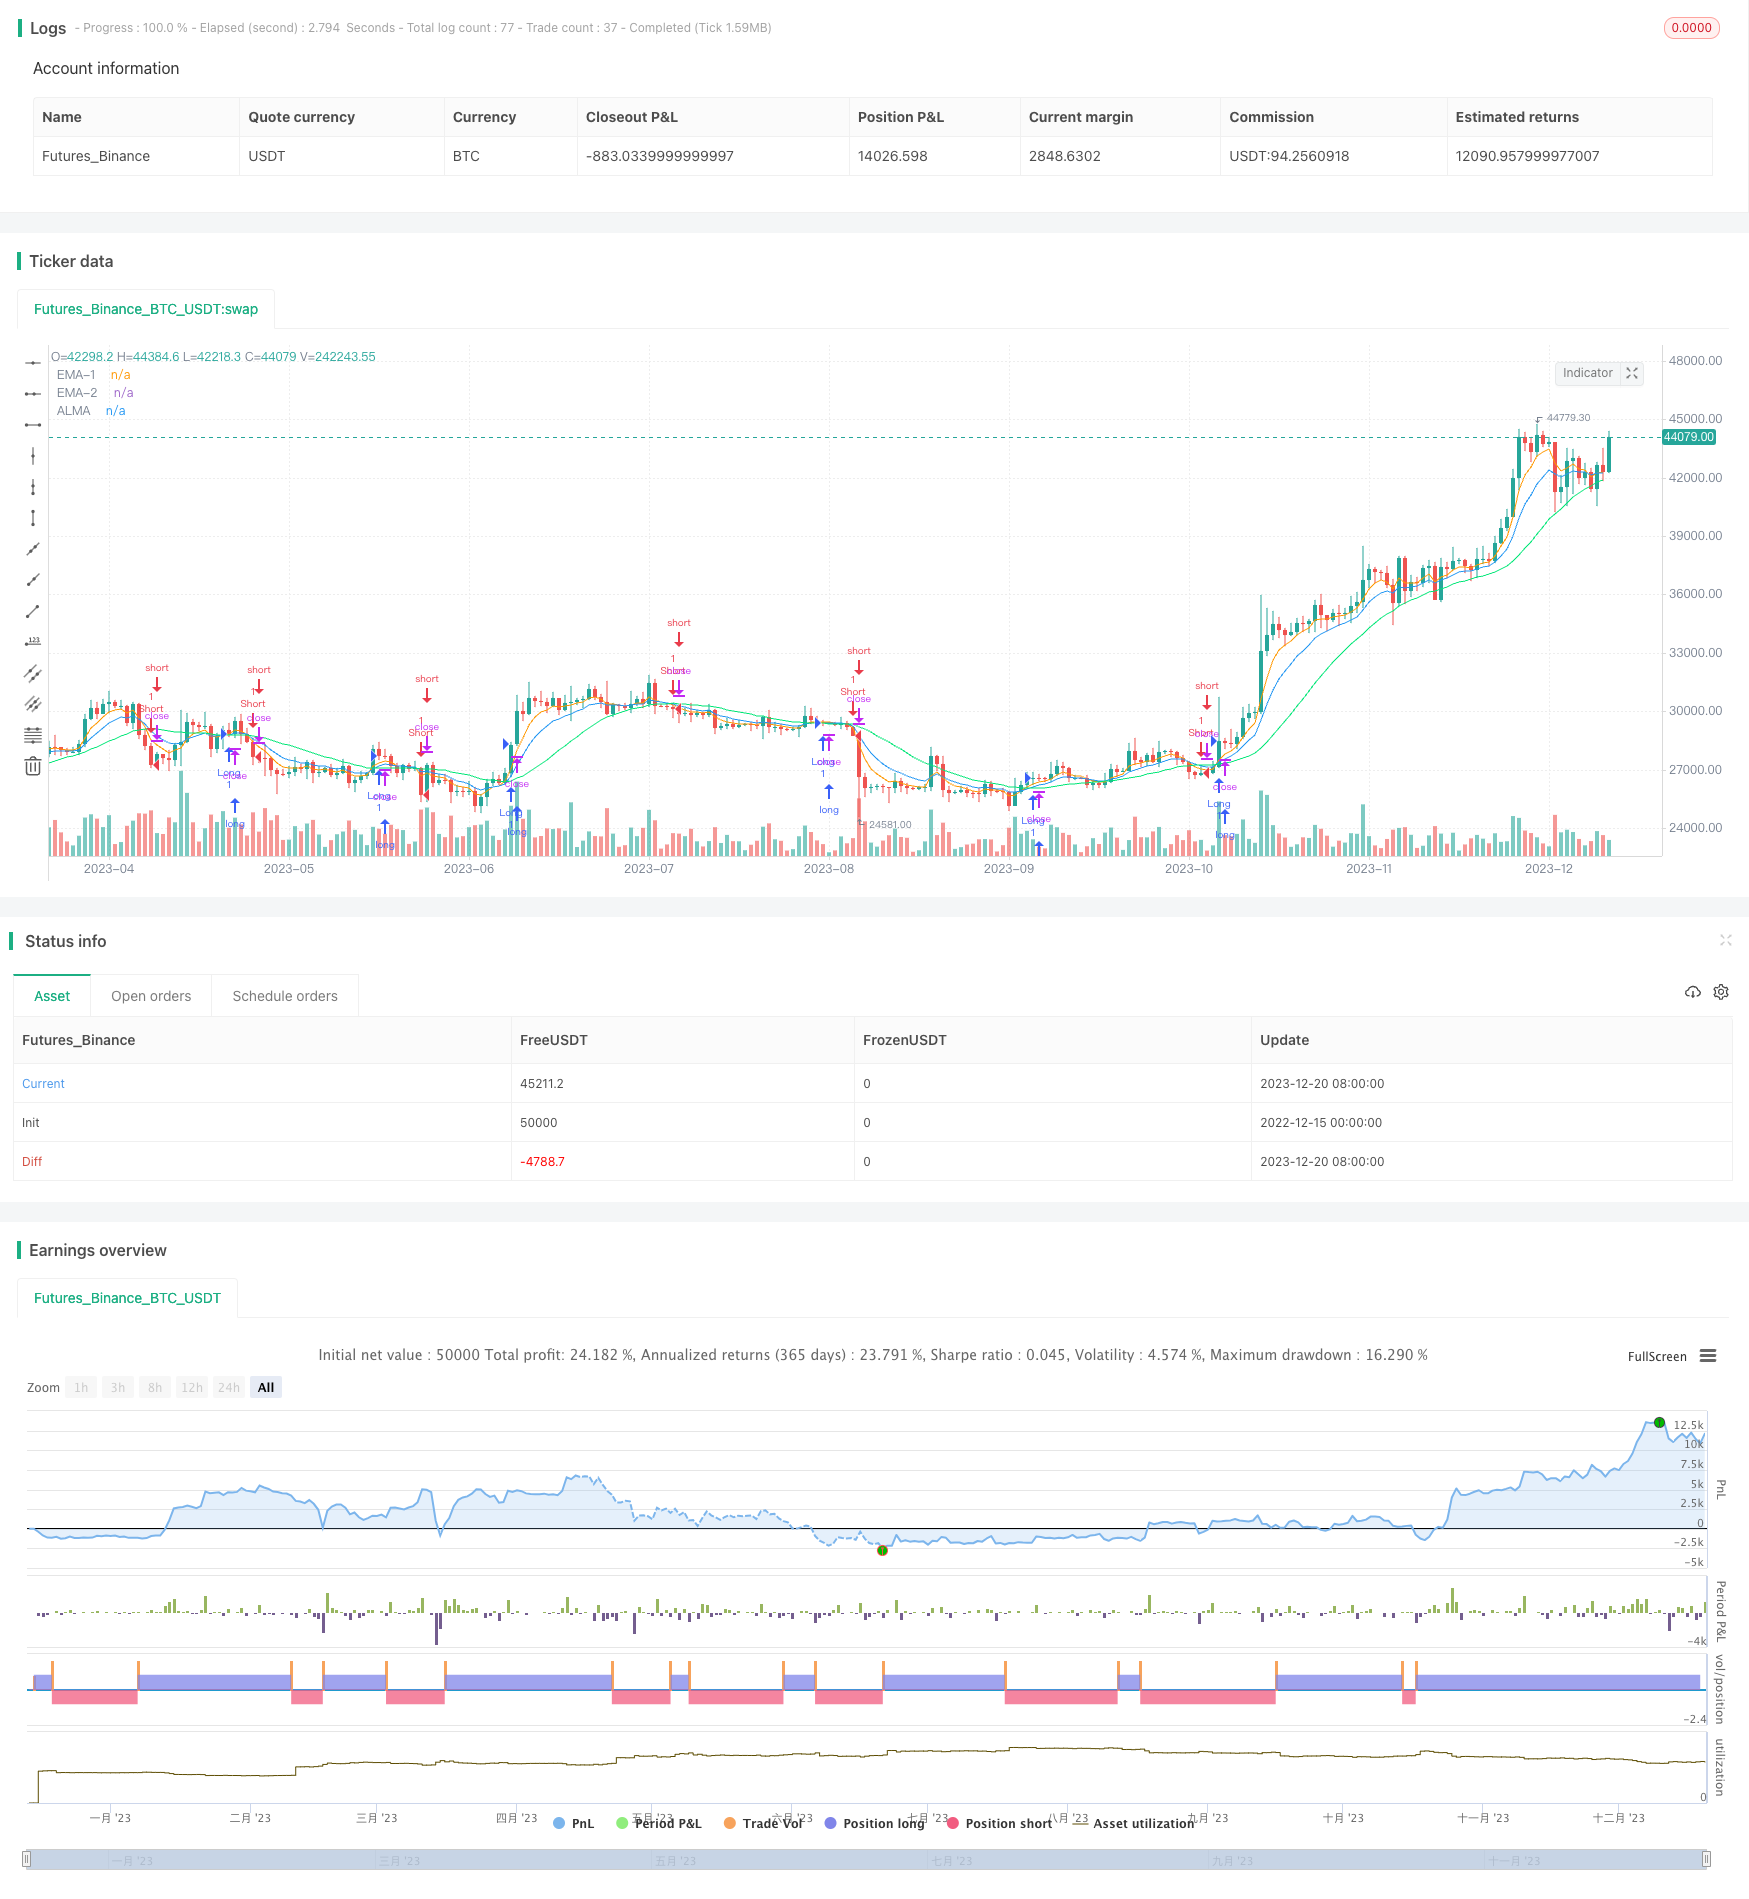
이 전략은 트렌드 추적과 입장을 구현하기 위해 쌍 지수 이동 평균과 알마 지표를 결합합니다. 그 중 알마 라인이 주요한 트렌드 필터로써, 가격이 알마 라인 위에 할 때 더하고, 가격이 알마 라인 아래에 할 때 더 텅 비습니다. 쌍 지수 이동 평균은 일찍 입장을 위해 사전 트렌드 신호를 제공하기 위해 사용됩니다.
전략 원칙
- 빠른 라인 EMA1과 느린 라인 EMA2의 이중 지수 이동 평균을 계산한다.
- 알마 선을 계산한다.
- 빠른 라인 EMA1과 느린 라인 EMA2가 골드포크를 형성할 때, 가격이 알마 라인보다 높으면 더 많이 하고, 빠른 라인 EMA1과 느린 라인 EMA2가 죽은 포크를 형성할 때, 가격이 알마 라인보다 낮으면 더 많이 하고, 낮은 라인 EMA2가 EMA1과 EMA2가 죽은 포크를 형성할 때, 낮은 라인 알마 라인보다 더 많이 하고, 빈 라인 EMA1과 EMA2가 알마 라인보다 더 많은 가격을 형성할 때, 빈 라인 EMA1과 EMA2가 알마 라인보다 더 많은 가격을 형성할 때, 빈 라인 EMA2가 알마 라인보다 더 많은 가격을 형성할 때, 빈 라인 EMA1과 EMA2가 알마 라인보다 더 많은 가격을 형성할 때, 빈 라인 EMA2가 알마 라인보다 더 많은 가격을 형성할 때, 빈 라인 EMA2가 알마 라인보다 더 많은 가격을 형성할 때, 빈 라인 EMA2가 알마 라인보다 더 많은 가격을 형성할 때.
- 이렇게, 알마 라인은 주요 트렌드 필터로 사용되어 흔들리는 시장에서 피되는 것을 피한다. 이중 지수 이동 평균은 일찍 입문하기 위해 미리 트렌드 신호를 제공하는 데 사용됩니다.
우위 분석
- 이중 지수 이동 평균은 가격 추세를 미리 반영하여 흔들림 영역에 들어가는 것을 피할 수 있다.
- 알마 선은 평평한 변수들에 적응하여 동적으로 트렌드를 포착할 수 있어 좋은 트렌드 필터 지표이다.
- 이 두 가지의 조합은 트렌드의 함을 고려하면서도 입시의 신뢰성을 보장합니다.
위험 분석
- 가격의 급격한 변동이 있을 때, 이중 지수 이동 평균은 잘못된 신호를 보낼 수 있다.
- 알마 라인 (Alma Line) 은 가격에 뒤쳐져 있는 현상이 발생하여, 일부 추세가 필터링될 수 있다.
- 잘못된 변수 설정으로 인해 정책이 제대로 작동하지 않습니다.
해결책:
- 쌍 지수 이동 평균의 주기적 조정으로 잘못된 신호율을 줄인다.
- 알마 선의 파라미터를 조정하여 지연을 줄입니다.
- 최적의 변수 조합을 찾기 위해 변수 최적화를 수행하십시오.
최적화 방향
- 서로 다른 주기들의 이중 지수 이동 평균 조합을 테스트하여 최적의 변수를 찾는다.
- 알마 선의 다양한 창 기간, 편향량, 시그마 값, 최적화 파라미터를 테스트한다.
- 변동률 지표와 같은 다른 지표와 결합하여 신호를 더욱 필터링한다.
- 손해 방지 전략을 최적화하고 단편적 손실을 통제합니다.
요약하다
이 전략은 이중 지수 이동 평균과 알마 지표와 결합하여 트렌드의 시간적 추적과 신뢰할 수 있는 입문 필터를 구현한다. 파라미터를 최적화하고 손실을 막는 전략의 개선을 통해 잘못된 신호를 더욱 줄이고 위험을 제어하고 전략의 효과를 향상시킬 수 있다. 이 전략은 트렌드적인 행동, 특히 중장기 거래에 적합하다.
전략 소스 코드
/*backtest
start: 2022-12-15 00:00:00
end: 2023-12-21 00:00:00
period: 1d
basePeriod: 1h
exchanges: [{"eid":"Futures_Binance","currency":"BTC_USDT"}]
*/

//@version=3
//Author: HighProfit

//Lead-In
strategy("Double Exponential Moving Avarage & Arnoud Legoux Moving Avarage Strategy", shorttitle="ST-DEMA+ALMA", overlay=true)

//Arnoud Legoux Moving Avarage Inputs
source = close
windowsize = input(title="Window Size", defval=50)
offset = input(title="Offset", type=float, defval=0.85)
sigma = input(title="Sigma", type=float, defval=6)

//Exponential Moving Avarage Inputs
L1= input(5,"EMA-1")
L2= input(10,"EMA-2")

//Exponential Moving Avarage Calculations
e1= ema(close, L1)
e2= ema(close, L2)

//Conditions
longCondition = e1 and e2 > alma(source, windowsize, offset, sigma)
if (longCondition)
    strategy.entry("Long", strategy.long)

shortCondition = e1 and e2 < alma(source, windowsize, offset, sigma)
if (shortCondition)
    strategy.entry("Short", strategy.short)

//Plots
plot(alma(source, windowsize, offset, sigma), color=lime, linewidth=1, title="ALMA")
plot(e1, color=orange, linewidth=1, title="EMA-1")
plot(e2, color=blue, linewidth=1, title="EMA-2")