개요
이 전략은 알고리즘 트레이딩 로봇에 적용되는 매우 사용자 정의 가능한 MACD 및 MFI 지표의 조합 전략입니다. 트렌드 지표와 동력 지표를 결합하여 여러 필터를 통해 거래 신호를 생성합니다.
전략 원칙
이 전략은 MACD 지표를 사용하여 시장의 경향 방향을 판단한다. MACD는 트렌드 추적형 운동 지표이며, 빠른 이동 평균선 (Fast Moving Average) 을 빼고 느린 이동 평균선 (Slow Moving Average) 을 빼면 MACD 기둥 모양의 도표를 얻으며 MACD의 지표 이동 평균을 사용하여 신호선을 얻는다. 빠른 선에서 선을 천천히 통과하면 구매 신호가 되고, 아래로 이동하면 판매 신호가 된다.
또한, 이 전략은 MFI 지표를 사용하여 시장의 과매매 상태를 판단한다. MFI 지표는 가격과 거래량 정보를 결합하고, 값은 0에서 100 사이로 변동한다. MFI는 20보다 낮으면 과매 지역이며, 80보다 높으면 과매 지역이다.
가짜 신호를 필터링하기 위해, 이 전략은 또한 트렌드 필터와 RSI 필터를 추가했다. 가격이 상승 추세에 있고 RSI가 정한 경치보다 작을 때 구매 신호가 발생한다.
전략적 이점
- 여러 지표를 조합하여 시장 상태를 종합적으로 판단하여 승률을 높여줍니다.
- 필터 메커니즘을 추가하여 가짜 신호를 방지하고 불필요한 거래를 줄이십시오.
- 다양한 매개 변수와 필터는 다양한 품종과 거래 선호도에 맞게 사용자 정의 할 수 있습니다.
- 수동 거래에 사용할 수 있으며, 알고리즘 로봇을 연결하여 프로그래밍 거래가 가능합니다.
전략적 위험과 해결 방법
지표 파라미터를 잘못 설정하면 가짜 신호가 발생하기 쉽다
다양한 변수를 테스트하여 최적의 변수 조합을 선택할 수 있습니다.
다중 품종 매개 변수는 통용되지 않으며 개별 테스트 및 최적화가 필요합니다.
거래 빈도가 너무 높아서 거래 비용과 점유율 위험이 증가할 수 있습니다.
조정할 수 있는 필터로 거래 빈도를 낮출 수 있습니다.
실제 거래시 비용 통제에 주의하십시오.
전략 최적화 방향
- 더 긴 데이터 사이클을 테스트하여 변수 안정성을 평가합니다.
- 다른 지표 변수 조합을 시도합니다.
- 지표 중량을 최적화하여 전략적 안정성을 높여라
- 필터를 추가하여 불필요한 거래를 줄이십시오.
요약하다
이 전략은 고도로 사용자 정의 가능한 트렌드 추적형 전략으로, 트렌드 및 동력 지표와 결합하여 시장 상태를 판단하고, 필터 메커니즘을 효과적으로 사용하여 위험을 제어한다. 수동 거래에 사용할 수 있으며, 알고리즘 로봇을 연결하여 자동화 된 프로그래밍 거래를 구현할 수 있으며, 장기적으로 추적할 가치가 있는 최적화된 전략 체계이다.
/*backtest
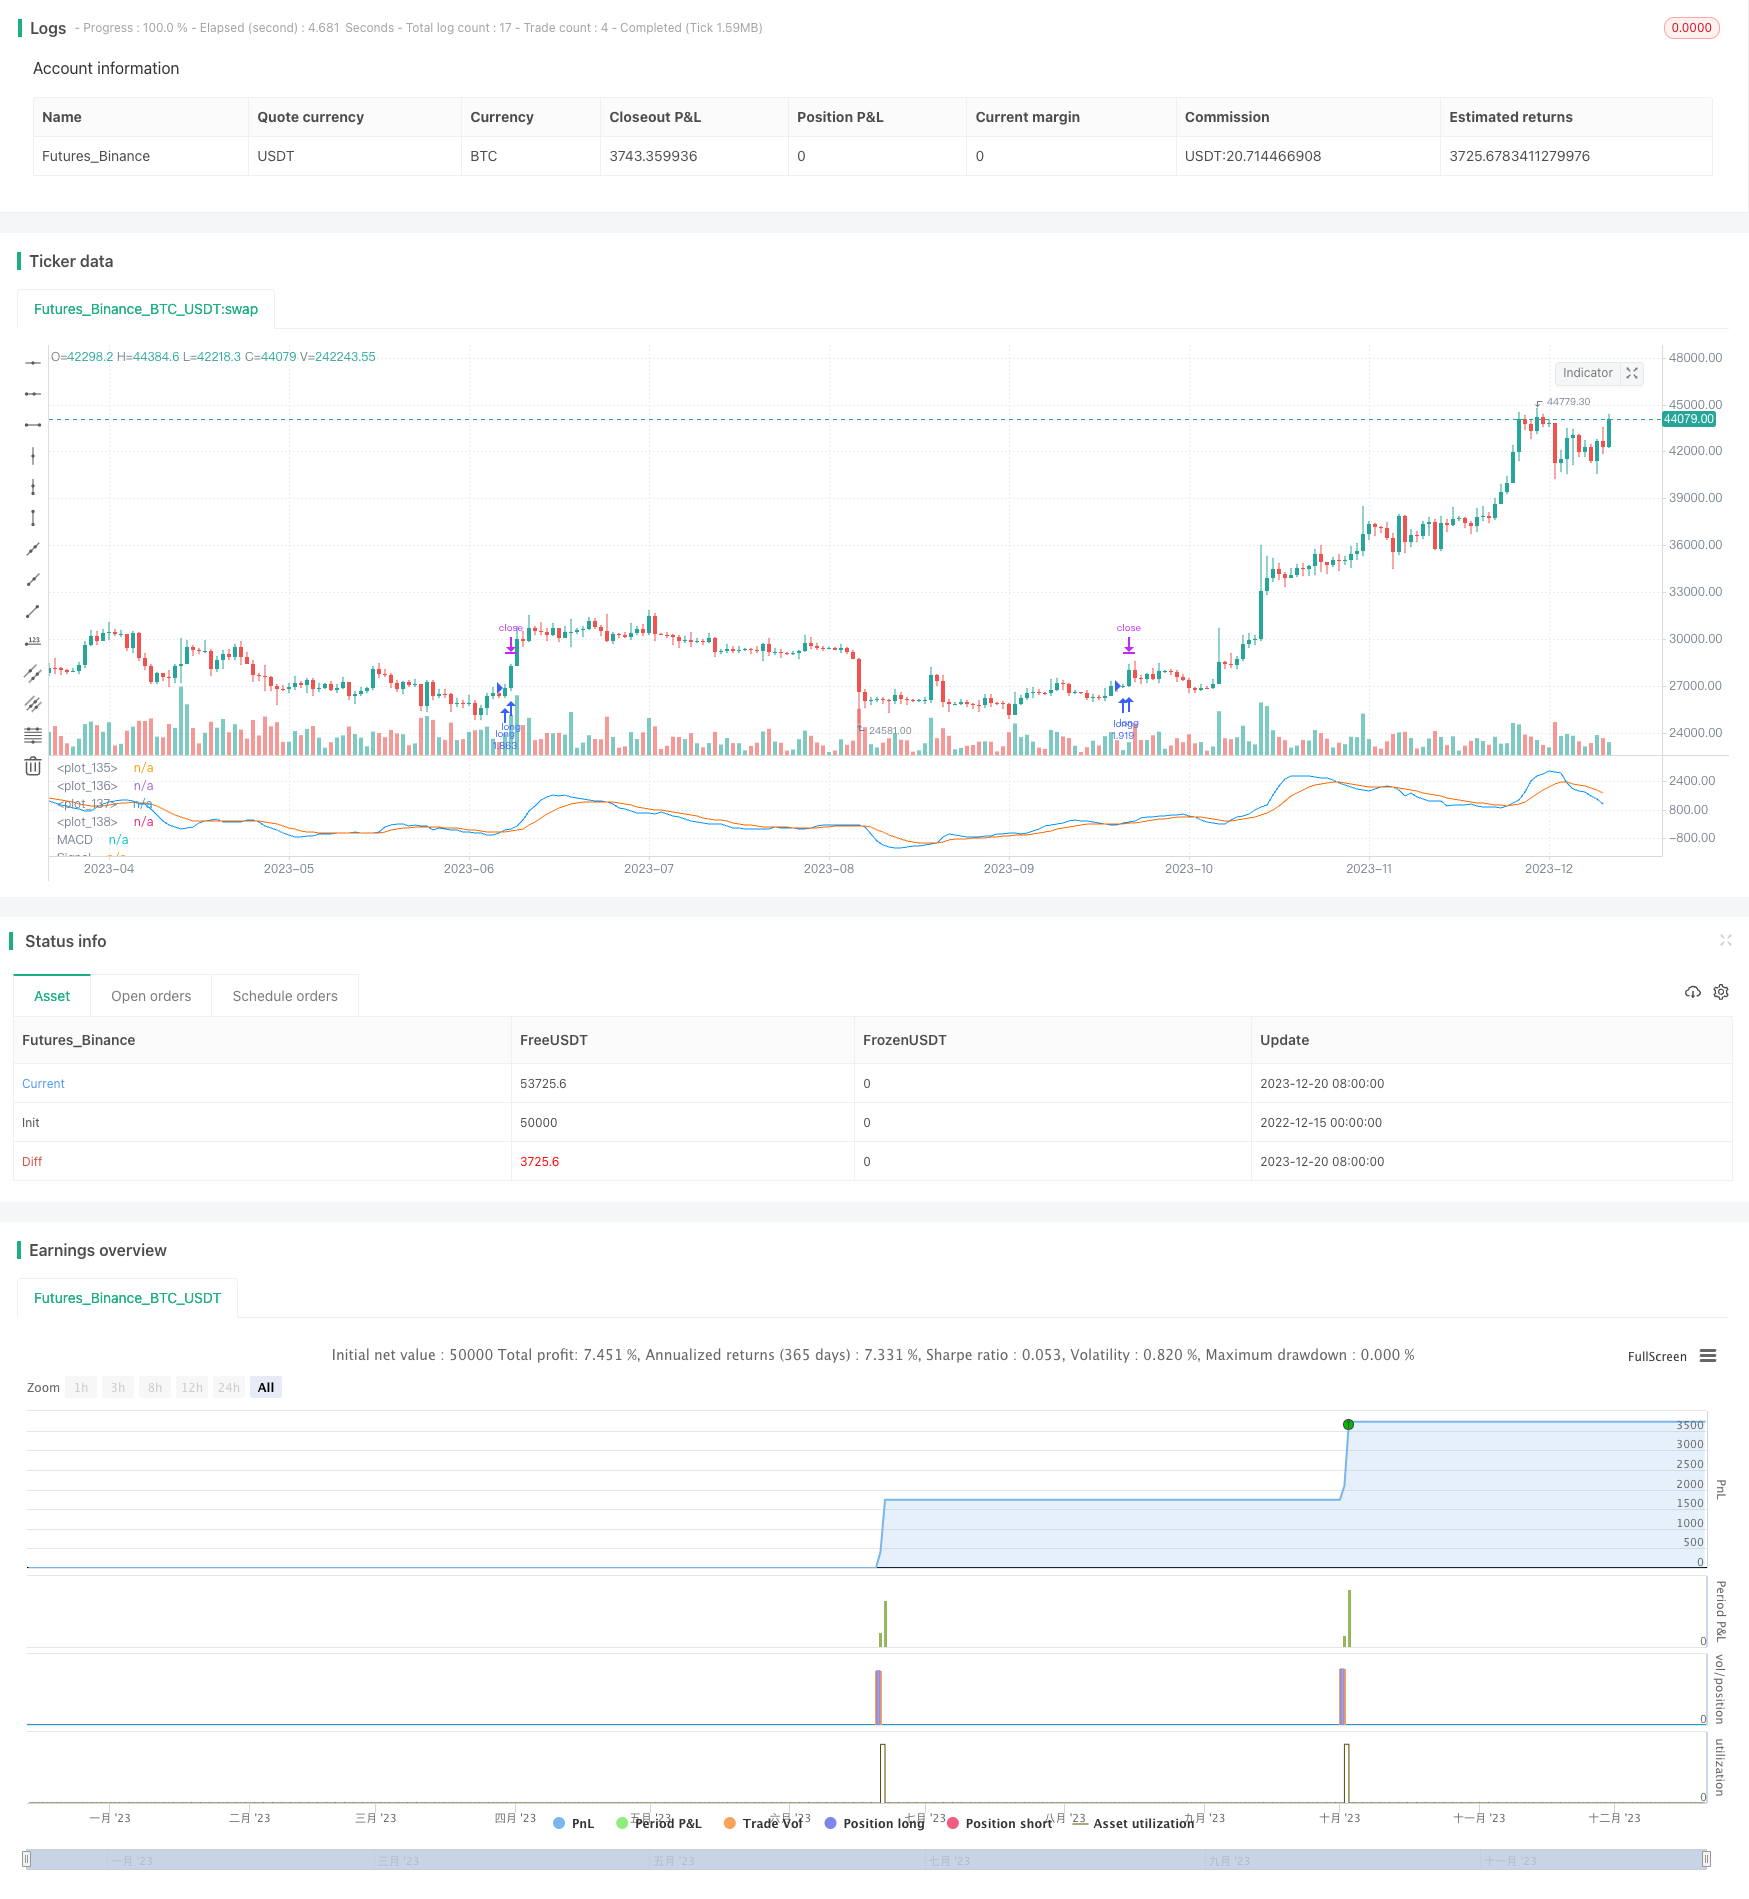
start: 2022-12-15 00:00:00
end: 2023-12-21 00:00:00
period: 1d
basePeriod: 1h
exchanges: [{"eid":"Futures_Binance","currency":"BTC_USDT"}]
*/
//(c) Wunderbit Trading
//Modified by Mauricio Zuniga - Trade at your own risk
//This script was originally shared on Wunderbit website as a free open source script for the community. (https://help.wundertrading.com/en/articles/5246468-macd-mfi-trading-bot-for-ftx)
//
//WHAT THIS SCRIPT DOES:
// This is a scalping script originally intended to be used on altorightmic bot trading.
// This strategy is based on the trend-following momentum indicator. It includes the Money Flow index as an additional point for entry.
//HOW IT DOES IT:
// It uses a combination of MACD and MFI indicators to create entry signals. Parameters for each indicator have been surfaced for user configurability.
// Take profits are fixed, but stop loss uses ATR configuration to minimize losses and close profitably.
//HOW IS MY VERSION ORIGINAL:
// I started trying to deploy this script myself in my algorithmic tradingg but ran into some issues which I have tried to address in this version.
// Delayed Signals : The script has been refactored to use a time frame drop down. The higher time frame can be run on a faster chart (recommended on one minute chart for fastest signal confirmation and relay to algotrading platform.
// Repainting Issues : All indicators have been recoded to use the security function that checks to see if the current calculation is in realtime, if it is, then it uses the previous bar for calculation.
// If you are still experiencing repainting issues based on intended (or non intended use), please provide a report with screenshot and explanation so I can try to address.
// Filtering : I have added to additional filters an ABOVE EMA Filter and a BELOW RSI Filter (both can be turned on and off)
// Customizable Long and Clos Messages : This allows someone to use the script for algorithmic trading without having to alter code. It also means you can use one indicator for all of your different alterts required for your bots.
//HOW TO USE IT:
// Find a pair with high volatility - I have found it works particularly well with 3L and 3S tokens for crypto. although it the limitation is that confrigurations I have found to work typically have low R/R ratio, but very high win rate and profit factor.
// Ieally set one minute chart for bots, but you can use other charts for manual trading. The signal will be delayed by one bar but I have found configurations that still test well.
// Select a time frame in configuration for your indicator calculations.
// I like ot use 5 and 15 minutes for scalping scenarios, but I am interested in hearing back from other community memebers.
// Optimize your indicator without filters (trendFilter and RSI Filter)
// Use the TrendFilter and RSI Filter to further refine your signals for entry.
//@version=4
strategy("Customizable HTF MACD Strategy v1.2", overlay=false, pyramiding=0, commission_type=strategy.commission.percent, commission_value=0.07, default_qty_type = strategy.percent_of_equity, default_qty_value = 100, currency = currency.USD)
openlongcomment = "Comment In Here"
closelongcomment = ""
openshortcomment = ""
closeshortcommment = ""
//RES
res = input(title="Resolution", type=input.resolution, defval="5", group="Strategy", inline="1")
comment = input(title="Open Long Comment", type=input.string, defval="",group="Strategy", inline="1")
if not(comment == "")
openlongcomment := comment
// FUNCTIONS
Ema(src,p) =>
ema = 0.
sf = 2/(p+1)
ema := nz(ema[1] + sf*(src - ema[1]),src)
Sma(src,p) => a = cum(src), (a - a[max(p,0)])/max(p,0)
Atr(p, res) =>
atr = 0.
highHTF = security(syminfo.tickerid, res, high[barstate.isrealtime ? 1 : 0])
lowHTF = security(syminfo.tickerid, res, low[barstate.isrealtime ? 1 : 0])
closeHTF = security(syminfo.tickerid, res, close[barstate.isrealtime ? 1 : 0])
Tr = max(highHTF - lowHTF, max(abs(highHTF - closeHTF[1]), abs(lowHTF - closeHTF[1])))
atr := nz(atr[1] + (Tr - atr[1])/p,Tr)
ribbon_period = input(39, "Period", step=1)
htfClose = security(syminfo.tickerid, res, close[barstate.isrealtime ? 1 : 0])
leadLine1 = ema(htfClose, ribbon_period)
leadLine2 = sma(htfClose, ribbon_period)
// p3 = plot(leadLine1, color= #53b987, title="EMA", transp = 50, linewidth = 1)
// p4 = plot(leadLine2, color= #eb4d5c, title="SMA", transp = 50, linewidth = 1)
// fill(p3, p4, transp = 60, color = leadLine1 > leadLine2 ? #53b987 : #eb4d5c)
//Upward Trend
UT=leadLine2 < leadLine1
DT=leadLine2>leadLine1
//FILTER LOGIC
aboveTrend = input(true, title="Use Trend", group="Filters", inline='1', type=input.bool)
TrendLength = input(3, minval=1, title="Trend MA", group="Filters", inline='1', type=input.integer)
aboveTrendFilter = sma(htfClose,TrendLength)
useRSI = input(true, title="Use RSI", group="Filters", inline='2', type=input.bool)
RSILength = input(34, minval=1, title="RSI Length", group="Filters", inline='2') // used to calculate RSI
belowRSIFilter = input(50, minval=1, title="Buy Below RSI Filter", group="Filters", inline='2') // only buy if its below this RSI - doesn't seem to work as expected
rsi = rsi(htfClose,RSILength)
if not(useRSI)
belowRSIFilter = 100
if not(aboveTrend)
aboveTrendFilter = -1
// MACD
fast_length = input(title="Fast Length", type=input.integer, defval=7)
slow_length = input(title="Slow Length", type=input.integer, defval=23)
src = input(title="Source", type=input.source, defval=close)
signal_length = input(title="Signal Smoothing", type=input.integer, minval = 1, maxval = 50, defval = 10)
sma_source = input(title="Simple MA(Oscillator)", type=input.bool, defval=false)
sma_signal = input(title="Simple MA(Signal Line)", type=input.bool, defval=false)
// Plot colors
col_grow_above = #26A69A
col_grow_below = #FFCDD2
col_fall_above = #B2DFDB
col_fall_below = #EF5350
col_macd = #0094ff
col_signal = #ff6a00
srcHTF = security(syminfo.tickerid, res, src[barstate.isrealtime ? 1 : 0])
// Calculating
fast_ma = sma_source ? Sma(srcHTF, fast_length) : Ema(srcHTF, fast_length)
slow_ma = sma_source ? Sma(srcHTF, slow_length) : Ema(srcHTF, slow_length)
macd = fast_ma - slow_ma
signal = sma_signal ? Sma(macd, signal_length) : Ema(macd, signal_length)
hist = macd - signal
//plot(hist, title="Histogram", style=plot.style_columns, color=(hist>=0 ? (hist[1] < hist ? col_grow_above : col_fall_above) : (hist[1] < hist ? col_grow_below : col_fall_below) ), transp=0 )
plot(macd, title="MACD", color=col_macd, transp=0)
plot(signal, title="Signal", color=col_signal, transp=0)
/// MFI
MFIsource = hlc3
sourceHTF = security(syminfo.tickerid, res, MFIsource[barstate.isrealtime ? 1 : 0])
length = input(15, minval=1)
lower = input(12, minval=0, maxval=50)
upper = input(80, minval=50, maxval=100)
// DrawMFI_f=input(true, title="Draw MFI?", type=bool)
HighlightBreaches=input(true, title="Highlight Oversold/Overbought?")
volumeHTF = security(syminfo.tickerid, res, volume[barstate.isrealtime ? 1 : 0])
// MFI
upper_s = sum(volumeHTF * (change(sourceHTF) <= 0 ? 0 : sourceHTF), length)
lower_s = sum(volumeHTF * (change(sourceHTF) >= 0 ? 0 : sourceHTF), length)
mf = rsi(upper_s, lower_s)
mfp = plot(mf, color=color.new(color.gray,0), linewidth=1)
top = hline(upper, color=color.new(color.gray, 100), linewidth=1, editable=false)
bottom = hline(lower, color=color.new(color.gray,100), linewidth=1, editable=false)
hline(0, color=color.new(color.black,100), editable=false)
hline(100, color=color.new(color.black,100), editable=false)
// Breaches
b_color = (mf > upper) ? color.new(color.red,70) : (mf < lower) ? color.new(color.green,60) : na
bgcolor(HighlightBreaches ? b_color : na)
fill(top, bottom, color=color.gray, transp=75)
// TAKE PROFIT AND STOP LOSS
long_tp1_inp = input(1, title='Long Take Profit 1 %', step=0.1)/100
long_tp1_qty = input(20, title="Long Take Profit 1 Qty", step=1)
long_trailing = input(1.3, title='Trailing Stop Long', step=0.1) / 100
long_take_level_1 = strategy.position_avg_price * (1 + long_tp1_inp)
// Stop Loss
multiplier = input(2, "SL Mutiplier", minval=1, step=0.1)
ATR_period=input(40,"ATR period", minval=1, step=1)
// Strategy
entry_long=(crossover(macd,signal) or (crossover(mf,lower) and leadLine2 < leadLine1)) and rsi < belowRSIFilter and close > aboveTrendFilter
entry_price_long=valuewhen(entry_long,close,0)
//SL_floating_long = entry_price_long -( (entry_price_long)*multiplier/100)//*Atr(ATR_period,res)
//SL_floating_long = entry_price_long - multiplier*Atr(ATR_period,res)
SL_floating_long = entry_price_long - multiplier*Atr(ATR_period,res)
exit_long= close < SL_floating_long
///// BACKTEST PERIOD ///////
testStartYear = input(2018, "Backtest Start Year")
testStartMonth = input(1, "Backtest Start Month")
testStartDay = input(1, "Backtest Start Day")
testPeriodStart = timestamp(testStartYear, testStartMonth, testStartDay, 0, 0)
testStopYear = input(9999, "Backtest Stop Year")
testStopMonth = input(12, "Backtest Stop Month")
testStopDay = input(31, "Backtest Stop Day")
testPeriodStop = timestamp(testStopYear, testStopMonth, testStopDay, 0, 0)
testPeriod() =>
time >= testPeriodStart and time <= testPeriodStop ? true : false
if testPeriod()
if UT
strategy.entry("long", strategy.long, when=entry_long == true, comment=openlongcomment)
strategy.exit("TP1","long", qty_percent=long_tp1_qty, limit=long_take_level_1)
strategy.exit("Trail stop","long", comment=closelongcomment, trail_points=entry_price_long * long_trailing / syminfo.mintick, trail_offset=entry_price_long * long_trailing / syminfo.mintick)
strategy.close("long", exit_long == true, comment=closelongcomment )