개요
이 전략은 슈퍼 트렌드 지표를 사용하여 시장의 트렌드 방향을 식별하고, Heikin Ashi 그래프 형식과 결합하여 상장한다. 또한, 전략은 손실을 차단하기 위해 중지 위치와 중지 위치 기능을 미리 설정한다.
전략 원칙
슈퍼 트렌드 지표를 사용하여 시장의 경향 방향을 판단한다. 이 지표는 평균 실제 변동 범위와 특정 배수를 기반으로 상승과 하락을 결정한다. 가격이 상승 궤도를 돌파 할 때 시선 신호이며, 반대로 하락 신호이다.
Heikin Ashi 그래프 형태 필터링과 함께 시장에 진입하는 시점. 슈퍼 트렌드 지표가 신호를 발산할 때, Heikin Ashi 이 양선일 때 더하고, 음선일 때 공백한다.
스톱 리스 및 스톱 리스를 설정한다. 전략은 비율 스톱, 고정 스톱, 평균 실제 변동 스톱, 축점 스톱 등 다양한 스톱 방식을 제공한다. 스톱 방식에는 비율 스톱, 고정 스톱, 리스크 수익률 스톱 등이 있다.
우위 분석
슈퍼 트렌드 지표는 시장의 흐름을 효과적으로 추적하여 중요한 거래 기회를 놓치지 않도록합니다.
Heikin Ashi 필터는 시장에 출시될 때, 불필요한 거래를 줄이고 승률을 높일 수 있습니다.
여러 가지 손해 차단 방식이 선택 가능하며, 개인 취향에 따라 설정하여 위험을 효과적으로 제어할 수 있다.
새로운 신호가 나타나면 적극적으로 평지 입장을 재설치 할 수 있습니다. 최신 트렌드를 항상 따르도록 보장합니다.
위험 분석
슈퍼 트렌드 지표는 시장 변화에 반응하지 못하고 트렌드 전환점을 놓칠 수 있습니다.
Heikin Ashi 형식의 필터는 손실 거래의 발생을 완전히 피할 수 없습니다.
스톱 로즈 설정이 잘못되면 조기 출전하거나 손실이 너무 커질 수 있다.
반복되는 반복은 거래비용과 슬라이드 리스크를 높여줍니다.
슈퍼 트렌드 지표의 매개 변수를 조정하여 다른 지표들을 조합하여 필터링 및 최적화된 스톱을 통해 위와 같은 위험을 줄일 수 있다.
최적화 방향
슈퍼 트렌드 지표 파라미터를 조정하여 최적의 파라미터 조합을 찾습니다.
다른 가격 데이터를 슈퍼 트렌드 지표의 계산 소스로 시도하십시오.
KDJ 지수, 이동 평균 등과 같은 다른 지수 판단 필터를 추가하십시오.
최적의 리스크/이익 비율을 달성하기 위해 스톱 로즈 스의 설정을 최적화한다.
고정된 수량이나 자본 비율에 따라 포지션을 개설하는 효과를 테스트한다.
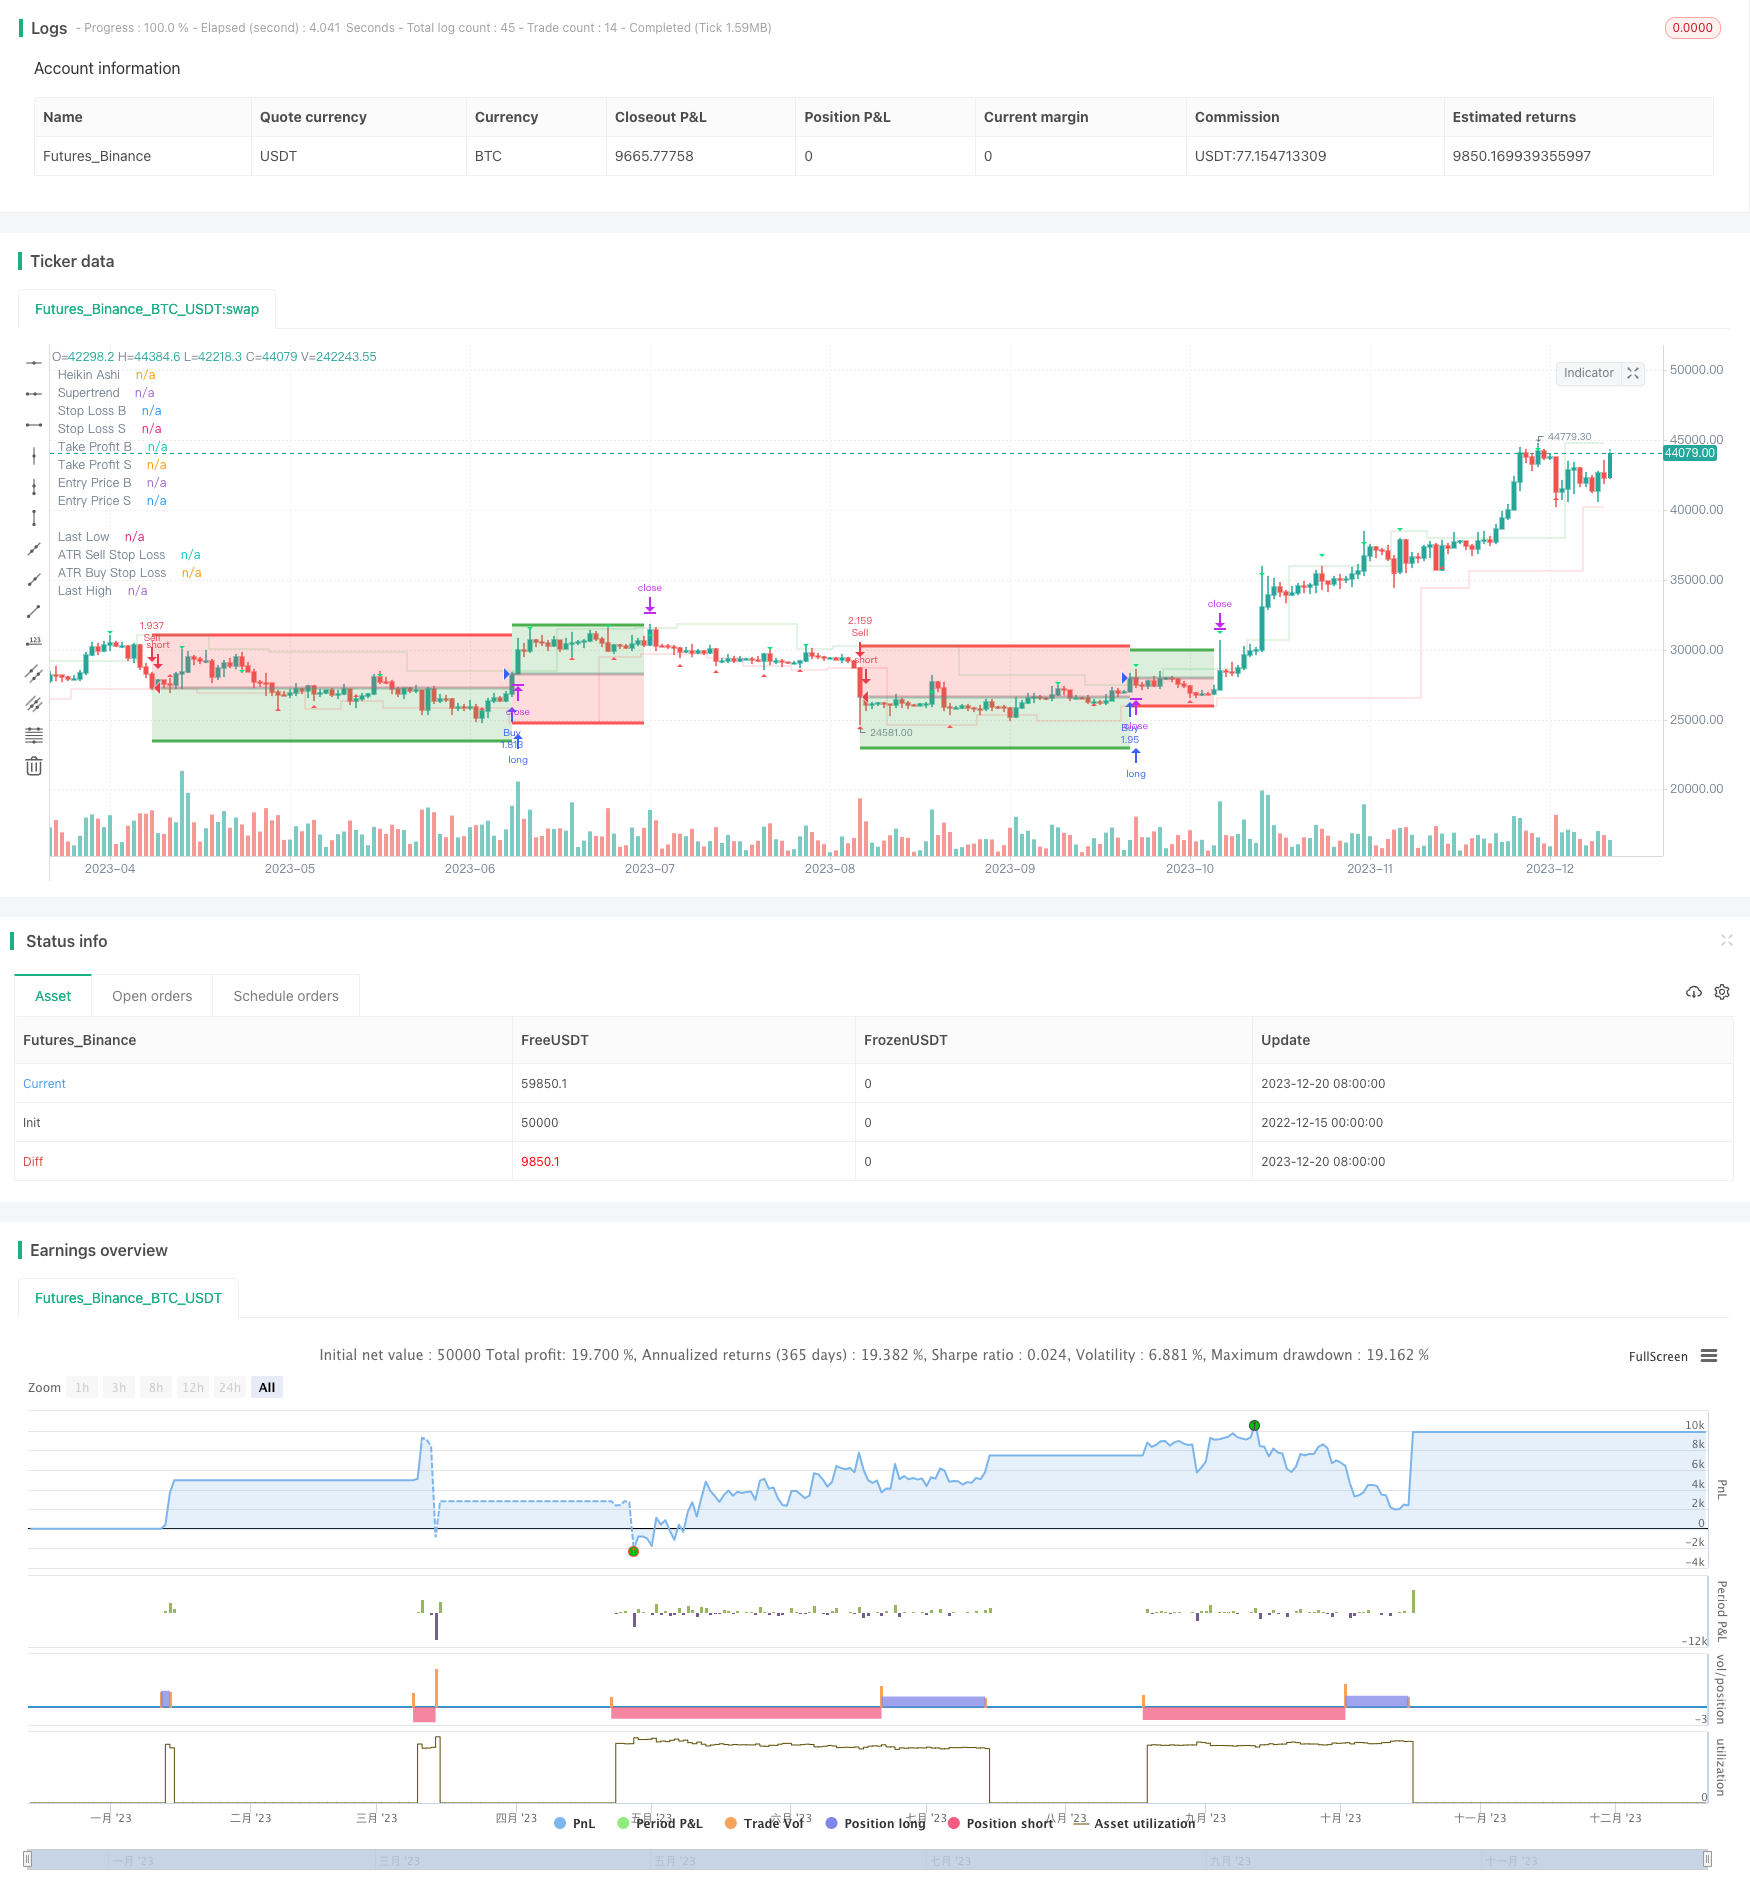
요약하다
이 전략은 슈퍼 트렌드 지표와 Heikin Ashi 기술을 통합하여 트렌드 방향을 추적하고 적절한 시점을 선택하여 시장의 트렌드 수익을 효과적으로 얻을 수 있습니다. 동시에 유연한 스톱 스탠드 설정은 위험 관리를 가능하게합니다. 매개 변수를 최적화하고 다른 필터 조건을 추가함으로써 전략의 안정성과 수익성을 더욱 강화 할 수 있습니다.
/*backtest
start: 2022-12-15 00:00:00
end: 2023-12-21 00:00:00
period: 1d
basePeriod: 1h
exchanges: [{"eid":"Futures_Binance","currency":"BTC_USDT"}]
*/


//# * —————————————————————————————————————————————————————————————————————————————————————————————————————————————————————
//# *
//# *  Script       |  [MT Trader] Backtest Template w/ Supertrend Strategy
//# *  Description  |  Small template open source made in pinescript with the purpose of testing
//# *                  different strategies and how they could be improved
//# *
//# *  Author       |  ©VertMT
//# *
//# *  Pinescript   |  https://www.tradingview.com/pine-script-docs/en/v5/Introduction.html
//# *                 @version=5
//# *
//# *  Revision History
//# *    Release    |  Jul 30, 2022  | Initial Release
//# *
//# *
//# *  Reference    |  https://tradingview.com/script/wzevYXew-TEMPLATE-Code-Block-Comments/
//# *
//# *
//# *    ███▄ ▄███▓ ▄▄▄█████▓
//# *   ▓██▒▀█▀ ██▒ ▓  ██▒ ▓▒
//# *   ▓██    ▓██░ ▒ ▓██░ ▒░
//# *   ▒██    ▒██  ░ ▓██▓ ░
//# *   ▒██▒   ░██▒   ▒██▒ ░
//# *   ░ ▒░   ░  ░   ▒ ░░
//# *   ░  ░      ░     ░
//# *   ░      ░      ░
//# *
//# * —————————————————————————————————————————————————————————————————————————————————————————————————————————————————————

//@version=5
strategy("[MT Trader] Backtest template w/ SuperTrend Strategy", overlay=true, pyramiding = 0, calc_on_order_fills = false, commission_type = strategy.commission.percent, commission_value = 0.03, default_qty_type = strategy.percent_of_equity, default_qty_value = 100, initial_capital=100, currency=currency.USD, process_orders_on_close=true, backtest_fill_limits_assumption=0)


// ————————————————————————————————————————————————————————————————————————————————————————————————————————————————————————
// —————————————————————————————————————— 1. 📆 Timeframe 📆 ——————————————————————————————————————————————————————————————
//# * —————————————————————————————————————————————————————————————————————————————————————————————————————————————————————
//# *
//# *        In this section you can configure the strategy so that it only runs between 2
//# *               time periods, being also able to adjust to any time zone.
//# *
//# *        En este apartado se puede configurar la estrategia para que solo se ejecute entre
//# *        2 periodos de tiempo, siendo capaz tambien de ajustarse a cualquier zona horaria.
//# *
// ————————————————————————————————————————————————————————————————————————————————————————————————————————————————————————


dateFilter  = input.bool(group='📆 Timeframe 📆', defval=false)
startTime   = input(group='📆 Timeframe 📆', defval=timestamp('01 Jan 2022 00:00'), title='Start Time')
endTime     = input(group='📆 Timeframe 📆', defval=timestamp('31 Dec 2022 23:45'), title='End Time')
zoneTime    = input.string("UTC", options = ["UTC-10", "UTC-8", "UTC-7", "UTC-6", "UTC-5", "UTC-4", "UTC-3", "UTC", "UTC+1", "UTC+2", "UTC+3", "UTC+4", "UTC+4:30", "UTC+5", "UTC+5:30", "UTC+6", "UTC+7", "UTC+8", "UTC+9", "UTC+9:30", "UTC+10", "UTC+11", "UTC+12", "UTC+12:45", "UTC+13"], title='UTC', group='📆 Timeframe 📆', tooltip="Match this time zone with that of your graph so that all values are displayed correctly. \n\nHaga coincidir esta zona horaria con la de su gráfico para que todos los valores se muestren correctamente.")

cTime = timestamp(year(timenow), month(timenow), dayofmonth(timenow), hour(timenow), minute(timenow))
sTime = timestamp(year(startTime), month(startTime), dayofmonth(startTime), hour(startTime), minute(startTime), second(startTime))
eTime = timestamp(year(endTime), month(endTime), dayofmonth(endTime), hour(endTime), minute(endTime), second(endTime))

bgcolor(dateFilter and time == sTime or dateFilter and time == eTime?color.new(color.white, 80):na, title="Date Range")
plotshape(dateFilter and time == sTime, title="Start Time", style=shape.labelup, location=location.belowbar, color=color.white, text="Start", textcolor=color.black, size=size.tiny)
plotshape(dateFilter and time == eTime, title="End Time",   style=shape.labelup, location=location.belowbar, color=color.white, text="End",   textcolor=color.black, size=size.tiny)

zcTime = zoneTime == "UTC-10" ? cTime - 10*60*60000 : zoneTime == "UTC-8" ? cTime - 8*60*60000 : zoneTime == "UTC-7" ? cTime - 7*60*60000 : zoneTime == "UTC-6" ? cTime - 6*60*60000 : zoneTime == "UTC-5" ? cTime - 5*60*60000 : zoneTime == "UTC-4" ? cTime - 4*60*60000 : zoneTime == "UTC-3" ? cTime - 3*60*60000 : zoneTime == "UTC" ? cTime - 0*60*60000 : zoneTime == "UTC+1" ? cTime + 1*60*60000 :  zoneTime == "UTC+2" ? cTime + 2*60*60000 : zoneTime == "UTC+3" ? cTime + 3*60*60000 : zoneTime == "UTC+4" ? cTime + 4*60*60000 : zoneTime == "UTC+4:30" ? cTime + 4*60*60000 + 30*60000 : zoneTime == "UTC+5" ? cTime + 5*60*60000 : zoneTime == "UTC+5" ? cTime + 5*60*60000 + 30*60000 : zoneTime == "UTC+6" ? cTime + 6*60*60000 : zoneTime == "UTC+7" ? cTime + 7*60*60000 : zoneTime == "UTC+8" ? cTime + 8*60*60000 : zoneTime == "UTC+9" ? cTime + 9*60*60000 : zoneTime == "UTC+9" ? cTime + 9*60*60000 + 30*60000 : zoneTime == "UTC+10" ? cTime + 10*60*60000 : zoneTime == "UTC+11" ? cTime + 11*60*60000 : zoneTime == "UTC+12" ? cTime + 12*60*60000 : zoneTime == "UTC+12:45" ? cTime + 12*60*60000 + 45*60000 : zoneTime == "UTC+13" ? cTime + 13*60*60000 : 0
zsTime = zoneTime == "UTC-10" ? sTime - 10*60*60000 : zoneTime == "UTC-8" ? sTime - 8*60*60000 : zoneTime == "UTC-7" ? sTime - 7*60*60000 : zoneTime == "UTC-6" ? sTime - 6*60*60000 : zoneTime == "UTC-5" ? sTime - 5*60*60000 : zoneTime == "UTC-4" ? sTime - 4*60*60000 : zoneTime == "UTC-3" ? sTime - 3*60*60000 : zoneTime == "UTC" ? sTime - 0*60*60000 : zoneTime == "UTC+1" ? sTime + 1*60*60000 :  zoneTime == "UTC+2" ? sTime + 2*60*60000 : zoneTime == "UTC+3" ? sTime + 3*60*60000 : zoneTime == "UTC+4" ? sTime + 4*60*60000 : zoneTime == "UTC+4:30" ? sTime + 4*60*60000 + 30*60000 : zoneTime == "UTC+5" ? sTime + 5*60*60000 : zoneTime == "UTC+5" ? sTime + 5*60*60000 + 30*60000 : zoneTime == "UTC+6" ? sTime + 6*60*60000 : zoneTime == "UTC+7" ? sTime + 7*60*60000 : zoneTime == "UTC+8" ? sTime + 8*60*60000 : zoneTime == "UTC+9" ? sTime + 9*60*60000 : zoneTime == "UTC+9" ? sTime + 9*60*60000 + 30*60000 : zoneTime == "UTC+10" ? sTime + 10*60*60000 : zoneTime == "UTC+11" ? sTime + 11*60*60000 : zoneTime == "UTC+12" ? sTime + 12*60*60000 : zoneTime == "UTC+12:45" ? sTime + 12*60*60000 + 45*60000 : zoneTime == "UTC+13" ? sTime + 13*60*60000 : 0
zeTime = zoneTime == "UTC-10" ? eTime - 10*60*60000 : zoneTime == "UTC-8" ? eTime - 8*60*60000 : zoneTime == "UTC-7" ? eTime - 7*60*60000 : zoneTime == "UTC-6" ? eTime - 6*60*60000 : zoneTime == "UTC-5" ? eTime - 5*60*60000 : zoneTime == "UTC-4" ? eTime - 4*60*60000 : zoneTime == "UTC-3" ? eTime - 3*60*60000 : zoneTime == "UTC" ? eTime - 0*60*60000 : zoneTime == "UTC+1" ? eTime + 1*60*60000 :  zoneTime == "UTC+2" ? eTime + 2*60*60000 : zoneTime == "UTC+3" ? eTime + 3*60*60000 : zoneTime == "UTC+4" ? eTime + 4*60*60000 : zoneTime == "UTC+4:30" ? eTime + 4*60*60000 + 30*60000 : zoneTime == "UTC+5" ? eTime + 5*60*60000 : zoneTime == "UTC+5" ? eTime + 5*60*60000 + 30*60000 : zoneTime == "UTC+6" ? eTime + 6*60*60000 : zoneTime == "UTC+7" ? eTime + 7*60*60000 : zoneTime == "UTC+8" ? eTime + 8*60*60000 : zoneTime == "UTC+9" ? eTime + 9*60*60000 : zoneTime == "UTC+9" ? eTime + 9*60*60000 + 30*60000 : zoneTime == "UTC+10" ? eTime + 10*60*60000 : zoneTime == "UTC+11" ? eTime + 11*60*60000 : zoneTime == "UTC+12" ? eTime + 12*60*60000 : zoneTime == "UTC+12:45" ? eTime + 12*60*60000 + 45*60000 : zoneTime == "UTC+13" ? eTime + 13*60*60000 : 0

tradeDateIsAllowed() =>
    dateFilter ? time >= sTime and time <= eTime : true
dateRange = tradeDateIsAllowed()


// ————————————————————————————————————————————————————————————————————————————————————————————————————————————————————————
// —————————————————————————————————————— 2. 🔰 Strategy 🔰 ———————————————————————————————————————————————————————————————
//# * —————————————————————————————————————————————————————————————————————————————————————————————————————————————————————
//# *
//# *                Here are located the options that you can use in this strategy.
//# *
//# *           Aqui se encuentran ubicados las opciones que puedes utilizar en esta estrategia.
//# *
//# *
//# *  Heikin Ashi  |  https://tradingview.com/script/U1QGgSOw-Heikin-Ashi-Source-Function-HTF/
//# *
// ————————————————————————————————————————————————————————————————————————————————————————————————————————————————————————


superTrend    =   input.bool(group='🔰 Strategy 🔰', defval=true,    title="Supertrend")
closeNewEntry =   input.bool(group='🔰 Strategy 🔰', defval=true,    title="Close Position on New Entry", tooltip="When it is active and a new alert is fired, the current position is closed to open a new one, otherwise, the operations only close when reach sl/tp \n\nCuando está activa y una nueva alerta es disparada se cierra la posicion actual para abrir una nueva, en caso contrario las operaciones solo se cierran al tocar sl/tp")
heikinPrice   =   input.bool(group='🔰 Strategy 🔰', defval=false,   title="Heikin Ashi Entry", tooltip="When activated, entries will be based on Heikin Ashi candles but executed at Japanese candles prices. Disable the border of the candles from chart settings for a better experience. \n\nCuando se active, las entradas se basarán en velas heikin ashi pero se ejecutarán a precios de velas japonesas. Deshabilite el borde de las velas desde la configuración del gráfico para una mejor experiencia.")


// —————————————————————————————————————— 1. Heikin Ashi Entry —————————————————————————————————————————————————————————————————


heikin(_src)  =>
    Close  = not heikinPrice ? close : ohlc4
    Open   = float(na)
    Open  := not heikinPrice ? open  : na(Open[1]) ? (open + close) / 2 : (nz(Open[1]) + nz(Close[1])) / 2
    High   = not heikinPrice ? high  : math.max(high, math.max(Open, Close))
    Low    = not heikinPrice ? low   : math.min(low,  math.min(Open, Close))
    HL2    = not heikinPrice ? hl2   : math.avg(High, Low)
    HLC3   = not heikinPrice ? hlc3  : math.avg(High, Low, Close)
    OHLC4  = not heikinPrice ? ohlc4 : math.avg(Open, High, Low, Close)
    HLCC4  = not heikinPrice ? ohlc4 : math.avg(High, Low, Close, Close)
    Price  = _src == 'close' ? Close : _src == 'open' ? Open : _src == 'high' ? High : _src == 'low' ? Low : _src == 'hl2' ? HL2 : _src == 'hlc3' ? HLC3 : _src == 'ohlc4' ? OHLC4 : HLCC4
    Source = math.round(Price / syminfo.mintick) * syminfo.mintick

heikinColor   = heikin('close') > heikin('open') ? #26a69a : #ef5350
plotcandle(heikin('open'), heikin('high'), heikin('low'), heikin('close'), title="Heikin Ashi", color=heikinColor, wickcolor=heikinColor, bordercolor=heikinColor)
barcolor(color=color.new(heikinPrice ? heikinColor:na, 100))

Open  = heikinPrice ? heikin('open')  : open
High  = heikinPrice ? heikin('high')  : high
Low   = heikinPrice ? heikin('low')   : low
Close = heikinPrice ? heikin('close') : close
HL2   = heikinPrice ? heikin('hl2')   : hl2
HLC3  = heikinPrice ? heikin('hl3')   : hlc3
OHLC4 = heikinPrice ? heikin('ohlc4') : ohlc4
HLCC4 = heikinPrice ? heikin('hlcc4') : hlcc4


// ————————————————————————————————————————————————————————————————————————————————————————————————————————————————————————
// —————————————————————————————————————— 2-1. Indicators —————————————————————————————————————————————————————————————————
//# * —————————————————————————————————————————————————————————————————————————————————————————————————————————————————————
//# *
//# *                         Here are the indicators used for the strategy
//# *
//# *                  Aqui se encuentran los indicadores usados para la estrategia.
//# *
//# *
//# *  Supertrend  |  https://tradingview.com/script/P5Gu6F8k/
//# *
// ————————————————————————————————————————————————————————————————————————————————————————————————————————————————————————

// —————————————————————————————————————— 1. Supertrend ———————————————————————————————————————————————————————————————————


stPeriods    = input(group="Supertrend", title='ATR Period', defval=10)
stSourceX    = input(group="Supertrend", title='Source', defval=hl2)
stMultiplier = input.float(group="Supertrend", title='ATR Multiplier', defval=3.0, step=0.1)
stChangeATR  = input(group="Supertrend", title='Change ATR Calculation Method ?', defval=false)
showsignals  = input(group="Supertrend", title='Plot Supertrend', defval=false)

varip float stSource = 0.0
stSource := stSourceX == close ? Close : stSourceX == open ? Open : stSourceX == high ? High : stSourceX == low ? Low : stSourceX == hl2 ? HL2 : stSourceX == hlc3 ? HLC3 : stSourceX == ohlc4 ? OHLC4 : HLCC4

tr   = math.max(High - Low, math.abs(High - Close[1]), math.abs(Low - Close[1]))    // The true range and functions that need olhc need to be calculated with the custom olhc values
atr2 = ta.sma(tr, stPeriods)                                                        // in lines 117-124 for the heikin ashi entries, otherwise the functions will be calculated with
atr  = stChangeATR ? atr2 : ta.rma(tr, stPeriods)                                   // Japanese values and the entries will be in Japanese candlesticks.
up   = stSource - stMultiplier * atr
up1  = nz(up[1], up)                                                                // El rango verdadero y las funciones que necesitan olhc, necesitan ser calculados con los valores
up   := Close[1] > up1 ? math.max(up, up1) : up                                     // olhc personalizados en las líneas 117-124 para las entradas heikin ashi, de lo contrario las
dn   = stSource + stMultiplier * atr                                                // funciones serán calculadas con valores japoneses y las entradas estarán en velas japonesas.
dn1  = nz(dn[1], dn)
dn   := Close[1] < dn1 ? math.min(dn, dn1) : dn
trend = 1
trend := nz(trend[1], trend)
trend := trend == -1 and Close > dn1 ? 1 : trend == 1 and Close < up1 ? -1 : trend

supertrend = trend == 1 ? true : false         //🔵
supertrendBuy  = trend == 1 and trend[1] == -1 //🟢
supertrendSell = trend == -1 and trend[1] == 1 //🔴


upPlot = plot(trend == 1 and showsignals ? up : na, title='Supertrend', style=plot.style_linebr, color=color.new(color.green, 0), linewidth=2)
dnPlot = plot(trend != 1 and showsignals ? dn : na, title='Supertrend', style=plot.style_linebr, color=color.new(color.red,   0), linewidth=2)

plotshape(supertrendBuy  and showsignals ? up : na, title='Supertrend', style=shape.circle,      color=color.new(color.green, 0), location=location.absolute, size=size.tiny)
plotshape(supertrendBuy  and showsignals ? up : na, title='Supertrend', style=shape.labelup,     color=color.new(color.green, 0), location=location.absolute, text='Buy',  textcolor=color.new(color.white, 0))

plotshape(supertrendSell and showsignals ? dn : na, title='Supertrend', style=shape.circle,      color=color.new(color.red,   0), location=location.absolute, size=size.tiny)
plotshape(supertrendSell and showsignals ? dn : na, title='Supertrend', style=shape.labeldown,   color=color.new(color.red,   0), location=location.absolute, text='Sell', textcolor=color.new(color.white, 0))

mPlot = plot(ohlc4, title='Supertrend', style=plot.style_circles, linewidth=0, color=color.new(color.white, 100))
longFillColor  = trend ==  1 ? color.green : color.white
shortFillColor = trend == -1 ? color.red   : color.white
fill(mPlot, upPlot, title='UpTrend Highligter',   color=color.new(longFillColor,  90))
fill(mPlot, dnPlot, title='DownTrend Highligter', color=color.new(shortFillColor, 90))


// ————————————————————————————————————————————————————————————————————————————————————————————————————————————————————————
// —————————————————————————————————————— 3. Stop Loss and Take Profit ————————————————————————————————————————————————————
//# * —————————————————————————————————————————————————————————————————————————————————————————————————————————————————————
//# *
//# *           Various options for stop loss and take profit are already pre-programmed to
//# *                   protect the investment from unexpected market movements.
//# *
//# *           Diversas opciones para stop loss y take profit se encuentran ya pre-programadas
//# *               para asi proteger la inversion de movimientos innesperados del mercado
//# *
//# *
// ————————————————————————————————————————————————————————————————————————————————————————————————————————————————————————


SL       = input.bool(   group="🔴 Stop Loss 🔴",   title="Use Stop Loss",     defval=true)
optionSL = input.string( group="🔴 Stop Loss 🔴",   title="Type of Stop",      defval="Last High/Low",        options = ["Fixed %", "Fixed $", "ATR", "Last High/Low", "Custom"])
fixedPSL = input.float(  group="🔴 Stop Loss 🔴",   title="Fixed %",           defval=1,   minval = 0)  / 100
fixedESL = input.float(  group="🔴 Stop Loss 🔴",   title="Fixed $",           defval=100, minval = 0)
atrL     = input.int(    group="🔴 Stop Loss 🔴",   title="ATR Lenght",        defval=14,  minval = 1)
atrM     = input.float(  group="🔴 Stop Loss 🔴",   title="ATR Multiplier",    defval=1,   minval = 0)
leftBHL  = input.int(    group="🔴 Stop Loss 🔴",   title="Last H/L Left",     defval=5,   minval = 1)
rightBHL = input.int(    group="🔴 Stop Loss 🔴",   title="last H/L Right",    defval=5,   minval = 1)
customSL = input.string( group="🔴 Stop Loss 🔴",   title="Custom",            defval="Custom",         options = ["Custom"])
trailSL  = input.bool(   group="🔴 Stop Loss 🔴",   title="Trailng Stop Loss", defval=false,            tooltip="The maximum stop loss price will decrease as the closing price moves further away from the entry price. \n\nEl precio maximo de stop loss ira disminuyendo mientras el precio de cierre se aleje mas del precio de entrada")

TP       = input.bool(   group="🟢 Take Profit 🟢", title="Use Take Profit",   defval=true)
optionTP = input.string( group="🟢 Take Profit 🟢", title="Type of Stop",      defval="Ratio 1:#",        options = ["Fixed %", "Fixed $", "Ratio 1:#", "Custom"])
fixedPTP = input.float(  group="🟢 Take Profit 🟢", title="Fixed %",           defval=1,   minval = 0)  / 100
fixedETP = input.float(  group="🟢 Take Profit 🟢", title="Fixed $",           defval=100, minval = 0)
ratioTP  = input.float(  group="🟢 Take Profit 🟢", title="Ratio 1:",          defval=1,   minval = 0)
customTP = input.string( group="🟢 Take Profit 🟢", title="Custom",            defval="Custom",         options = ["Custom"])

inOperationB = strategy.position_size >  0 ? true : false
inOperationS = strategy.position_size <  0 ? true : false
inOperation  = strategy.position_size != 0 ? true : false

varip float stopLossB   = 0
varip float takeProfitB = 0
varip float stopLossS   = 0
varip float takeProfitS = 0
varip float entryPrice  = 0
varip float entryPriceB = 0
varip float entryPriceS = 0
varip float trailingB = 0
varip float trailingS = 0

buy  = superTrend and supertrendBuy  //🟢
sell = superTrend and supertrendSell //🔴


// —————————————————————————————————————————— 1. ATR ————————————————————————————————————————————————————————————————————————

atrHigh = ta.rma(ta.tr(true), atrL) * atrM + high
atrLow  = low - ta.rma(ta.tr(true), atrL) * atrM

atrHighPlot = plot(atrHigh, title='ATR Sell Stop Loss', color=color.new(color.red,   not inOperation and optionSL == "ATR" ? 70 : 100), style=plot.style_stepline)
atrLowPlot  = plot(atrLow,  title='ATR Buy Stop Loss',  color=color.new(color.green, not inOperation and optionSL == "ATR" ? 70 : 100), style=plot.style_stepline)


// —————————————————————————————————————— 2. Pivot Points ———————————————————————————————————————————————————————————————————

mb = leftBHL + rightBHL + 1
highestbars_1 = ta.highestbars(mb)
lowestbars_1  = ta.lowestbars(mb)
iff_1 = highestbars_1 == -leftBHL ? high[leftBHL] : na
iff_2 = lowestbars_1  == -leftBHL ?  low[leftBHL] : na
lowest  = not na(high[mb]) ? iff_1 : na
highest = not na( low[mb]) ? iff_2 : na

varip float highestHigh = 0
varip float lowestLow = 0
highestHigh := ta.valuewhen(lowest, high[leftBHL], 0)
lowestLow   := ta.valuewhen(highest, low[leftBHL], 0)

plotshape(highest, title="Last Low",  color=color.new(color.red,   optionSL == "Last High/Low" ?  0 : 100), style=shape.triangleup,   location=location.belowbar, size=size.tiny, offset=-leftBHL)
plotshape(lowest,  title="Last High", color=color.new(color.lime,  optionSL == "Last High/Low" ?  0 : 100), style=shape.triangledown, location=location.abovebar, size=size.tiny, offset=-leftBHL)

plot(lowestLow,    title='Last Low',  color=color.new(color.red,   optionSL == "Last High/Low" ? 70 : 100), style=plot.style_stepline)
plot(highestHigh,  title='Last High', color=color.new(color.green, optionSL == "Last High/Low" ? 70 : 100), style=plot.style_stepline)


// —————————————————————————————————————— 3. Stop Loss ——————————————————————————————————————————————————————————————————————

calculateSL() =>
    varip float stopResult = 0
    varip float stop = 0

    if optionSL == "Fixed %"       and buy
        stop := entryPriceB - ( entryPriceB * fixedPSL)

    if optionSL == "Fixed %"       and sell
        stop := entryPriceS + ( entryPriceS * fixedPSL)

    if optionSL == "Fixed $"       and buy
        stop := entryPriceB - fixedESL

    if optionSL == "Fixed $"       and sell
        stop := entryPriceS + fixedESL

    if optionSL == "Last High/Low" and buy
        stop := lowestLow

    if optionSL == "Last High/Low" and sell
        stop := highestHigh

    if optionSL == "ATR"           and buy
        stop := atrLow

    if optionSL == "ATR"           and sell
        stop := atrHigh

    if optionSL == "Custom"        and buy
        stop := entryPriceB - ( entryPriceB * fixedPSL)

    if optionSL == "Custom"        and sell
        stop := entryPriceS + ( entryPriceS * fixedPSL)

    stopResult := stop


// —————————————————————————————————————— 4. Take Profit ————————————————————————————————————————————————————————————————————

calculateTP() =>
    varip float takeResult = 0
    varip float take = 0

    if optionTP == "Fixed %"            and buy
        take := entryPriceB + ( entryPriceB * fixedPTP)

    if optionTP == "Fixed %"            and sell
        take := entryPriceS - ( entryPriceS * fixedPTP)

    if optionTP == "Fixed $"            and buy
        take := entryPriceB + fixedETP

    if optionTP == "Fixed $"            and sell
        take := entryPriceS - fixedETP

    if optionTP == "Ratio 1:#"          and buy
        take := entryPriceB + ( trailingB * ratioTP )

    if optionTP == "Ratio 1:#"          and sell
        take := entryPriceS - ( trailingS * ratioTP )

    if optionTP == "Custom"             and buy
        take := entryPriceB + ( entryPriceB * fixedPTP)

    if optionTP == "Custom"             and sell
        take := entryPriceS - ( entryPriceS * fixedPTP)

    takeResult := take


// —————————————————————————————————————— 5. BUY ————————————————————————————————————————————————————————————————————————————

if inOperationB and trailSL and not buy
    stopLossBNew = close - trailingB
    stopLossB := stopLossBNew > stopLossB ? stopLossBNew : stopLossB[1]
    strategy.exit("Buy Exit", "Buy", stop=stopLossB, limit=takeProfitB)

if dateRange and buy and (((inOperation and closeNewEntry) or not inOperation))
    entryPrice  := close
    entryPriceB := close
    stopLossB   := SL ? calculateSL() : na
    trailingB   := close - stopLossB
    takeProfitB := TP ? calculateTP() : na
    strategy.entry("Buy", strategy.long, limit=entryPriceB)
    strategy.exit("Buy Exit", "Buy", stop=stopLossB, limit=takeProfitB)

if sell and inOperationB and not closeNewEntry
    strategy.cancel("Buy")

// —————————————————————————————————————— 6. SELL ———————————————————————————————————————————————————————————————————————————

if inOperationS and trailSL and not sell
    stopLossSNew = close + trailingS
    stopLossS := stopLossSNew > stopLossS ? stopLossSNew : stopLossS[1]
    strategy.exit("Sell Exit", "Sell", stop=stopLossS, limit=takeProfitS)

if dateRange and sell and (((inOperation and closeNewEntry) or not inOperation))
    entryPrice  := close
    entryPriceS := close
    stopLossS   := SL ? calculateSL() : na
    trailingS   := stopLossS - close
    takeProfitS := TP ? calculateTP() : na
    strategy.entry("Sell", strategy.short, limit=entryPriceS)
    strategy.exit("Sell Exit", "Sell", stop=stopLossS, limit=takeProfitS)

if sell and inOperationS and not closeNewEntry
    strategy.cancel("Sell")


slbp = plot(stopLossB,   color=color.new(color.red,   inOperationB ?  0 : 100), style=plot.style_linebr, linewidth=3, title="Stop Loss B")
slsp = plot(stopLossS,   color=color.new(color.red,   inOperationS ?  0 : 100), style=plot.style_linebr, linewidth=3, title="Stop Loss S")
tpbp = plot(takeProfitB, color=color.new(color.green, inOperationB ?  0 : 100), style=plot.style_linebr, linewidth=3, title="Take Profit B")
tpsp = plot(takeProfitS, color=color.new(color.green, inOperationS ?  0 : 100), style=plot.style_linebr, linewidth=3, title="Take Profit S")
epbp = plot(entryPriceB, color=color.new(color.gray,  inOperationB ? 50 : 100), style=plot.style_linebr, linewidth=3, title="Entry Price B")
epsp = plot(entryPriceS, color=color.new(color.gray,  inOperationS ? 50 : 100), style=plot.style_linebr, linewidth=3, title="Entry Price S")

fill(epbp, slbp, color=color.new(color.red,   inOperationB ? 75 : 100))
fill(epbp, tpbp, color=color.new(color.green, inOperationB ? 75 : 100))
fill(epsp, slsp, color=color.new(color.red,   inOperationS ? 75 : 100))
fill(epsp, tpsp, color=color.new(color.green, inOperationS ? 75 : 100))