개요
RSI 브레이크 전략은 상대적으로 강한 지수 (RSI) 지표에 기반한 양적 거래 전략이다. 이 전략은 RSI가 구매 지역과 판매 영역을 초과하는 하락점을 설정하여 RSI 지표가 이러한 하락점을 돌파 할 때 거래 신호를 발생시킵니다. 즉, RSI가 30 미만으로 할 때 더 많이하고, RSI가 70 미만으로 할 때 더 많이합니다.
전략 원칙
RSI 돌파 전략의 핵심 아이디어는 RSI 지표를 사용하여 시장의 과매매 현상을 판단하는 것입니다. RSI는 한 기간 동안의 주식의 평균 상승과 평균 하락의 비율을 계산하여 주식의 최근의 강약 상황을 반영합니다. 일반적으로 RSI는 30 이하의 과매매 현상, 70 이상의 과매매 현상으로 간주됩니다.
이 전략은 먼저 RSI의 오버셀 라인을 설정하고 오버빌 라인을 설정하여 30과 70을 기본으로 설정한다. 그리고는 RSI 라인의 동작을 실시간으로 모니터링한다. RSI가 위아래로 70을 돌파할 때 판매 신호가 발생한다. 이 때 시장이 오버빌 영역에 들어갔다고 판단하고, 예상되는 상위권에 도달할 가능성이 높기 때문에, 판매 포지션을 취한다. 반대로, RSI가 아래에서 위아래로 30을 돌파할 때 구매 신호가 발생한다.
이 방법으로, 전략은 주식의 변동 과정에서 가격 전환점을 포착하고, 과매매 현상이 발생했을 때 포지션을 적절히 조정하여, 매매 하락과 매매 하락을 달성한다.
전략적 이점
RSI 돌파 전략은 다음과 같은 장점이 있습니다.
동작 신호는 간단하고 명확하다. RSI 지표는 계산하고 이해하기 쉽다. 지표 라인을 뚫고 설정된 임계값의 상하계를 관찰하면 된다. 지표가 뚫렸을 때 작동할 수 있으며 복잡한 거래 규칙이 없다.
완전히 정량화, 재측정 효과가 좋다. 이 전략은 RSI 지표에서 거래 신호를 추출하고, 인간의 개입과 판단이 필요하지 않고, 자동 거래를 쉽게 구현할 수 있다. 또한 RSI의 과매매 신호 효과가 좋으며, 전략 재측정도 상당한 수익을 나타낸다.
커스터마이징이 강하다. 거래자는 RSI 파라미터를 다른 주식과 시장 상황에 맞는 특성에 맞게 조정할 수 있다.
전략적 위험
RSI 돌파 전략에는 다음과 같은 위험도 있습니다.
휘프사우가 형성되기 쉽다. 지표가 위아래로 흔들릴 때, 뚫린 거래 신호가 자주 발생한다. 이 때 전략은 과도한 무효 거래를 만들어 내며, 안정적인 수익을 얻는 데 도움이 되지 않는다. 적절한 변수를 조정하여 일부 흔들림 신호를 필터링 할 수 있다.
시장 경향을 판단할 수 없다. RSI는 오버 바이 오버 셀 상태에서만 거래 신호를 생성하며, 큰 경향을 판단하는 능력이 약하다. 전략은 불안정한 상황에서 쉽게 갇혀있다. 추세 지표와 함께 필터링하여 역동적인 거래를 피할 수 있다.
철회 위험은 크다. RSI는 종종 다중 방향의 탈선 행동을 나타냅니다. 즉, 가격이 계속 상승하고 RSI 지표는 내려갑니다. 이 때 전략이 공영되고 큰 추세에서 탈선하면 큰 손실이 발생할 것입니다.
전략 최적화
RSI 돌파 전략은 다음과 같은 차원에서 최적화될 수 있다:
여러 지표를 종합적으로 고려하여 단일 RSI 지표의 한계를 피하십시오. 예를 들어, 이동 평균 지표와 결합하여 시장 추세를 판단하거나, 강한 지표, 거래량 지표를 사용하여 조합 필터링 거래 신호.
전략의 안정성을 높이기 위해 RSI 파라미터를 최적화한다. 오버 바이 오버 시드 값을 조정하고 거래 신호의 지속 시간을 설정하는 등이 포함된다. 테스트를 통해 최적의 파라미터를 얻으며 무효 신호를 필터링한다.
위험을 제어하기 위해 스톱 로드 조건을 설정합니다. 예를 들어, 퍼센티지 또는 점수 스톱 로드를 설정합니다. 단일 손실이 전체 수익에 너무 큰 영향을 미치지 않도록하십시오.
요약하다
RSI 돌파 전략은 오버 바이 오버 셀드 현상을 활용하여 역전 거래를 하는 양적 전략이다. 전략 신호는 간단하고 명확하고 완전히 양적하며 사용자 정의가 강하다. 그러나 특정 휘파람 위험과 회수 위험도 존재한다. 지표 포트폴리오 최적화 및 위험 제어 등의 방법으로 RSI 돌파 전략을 안정적이고 신뢰할 수있는 양적 시스템으로 최적화 할 수 있습니다.
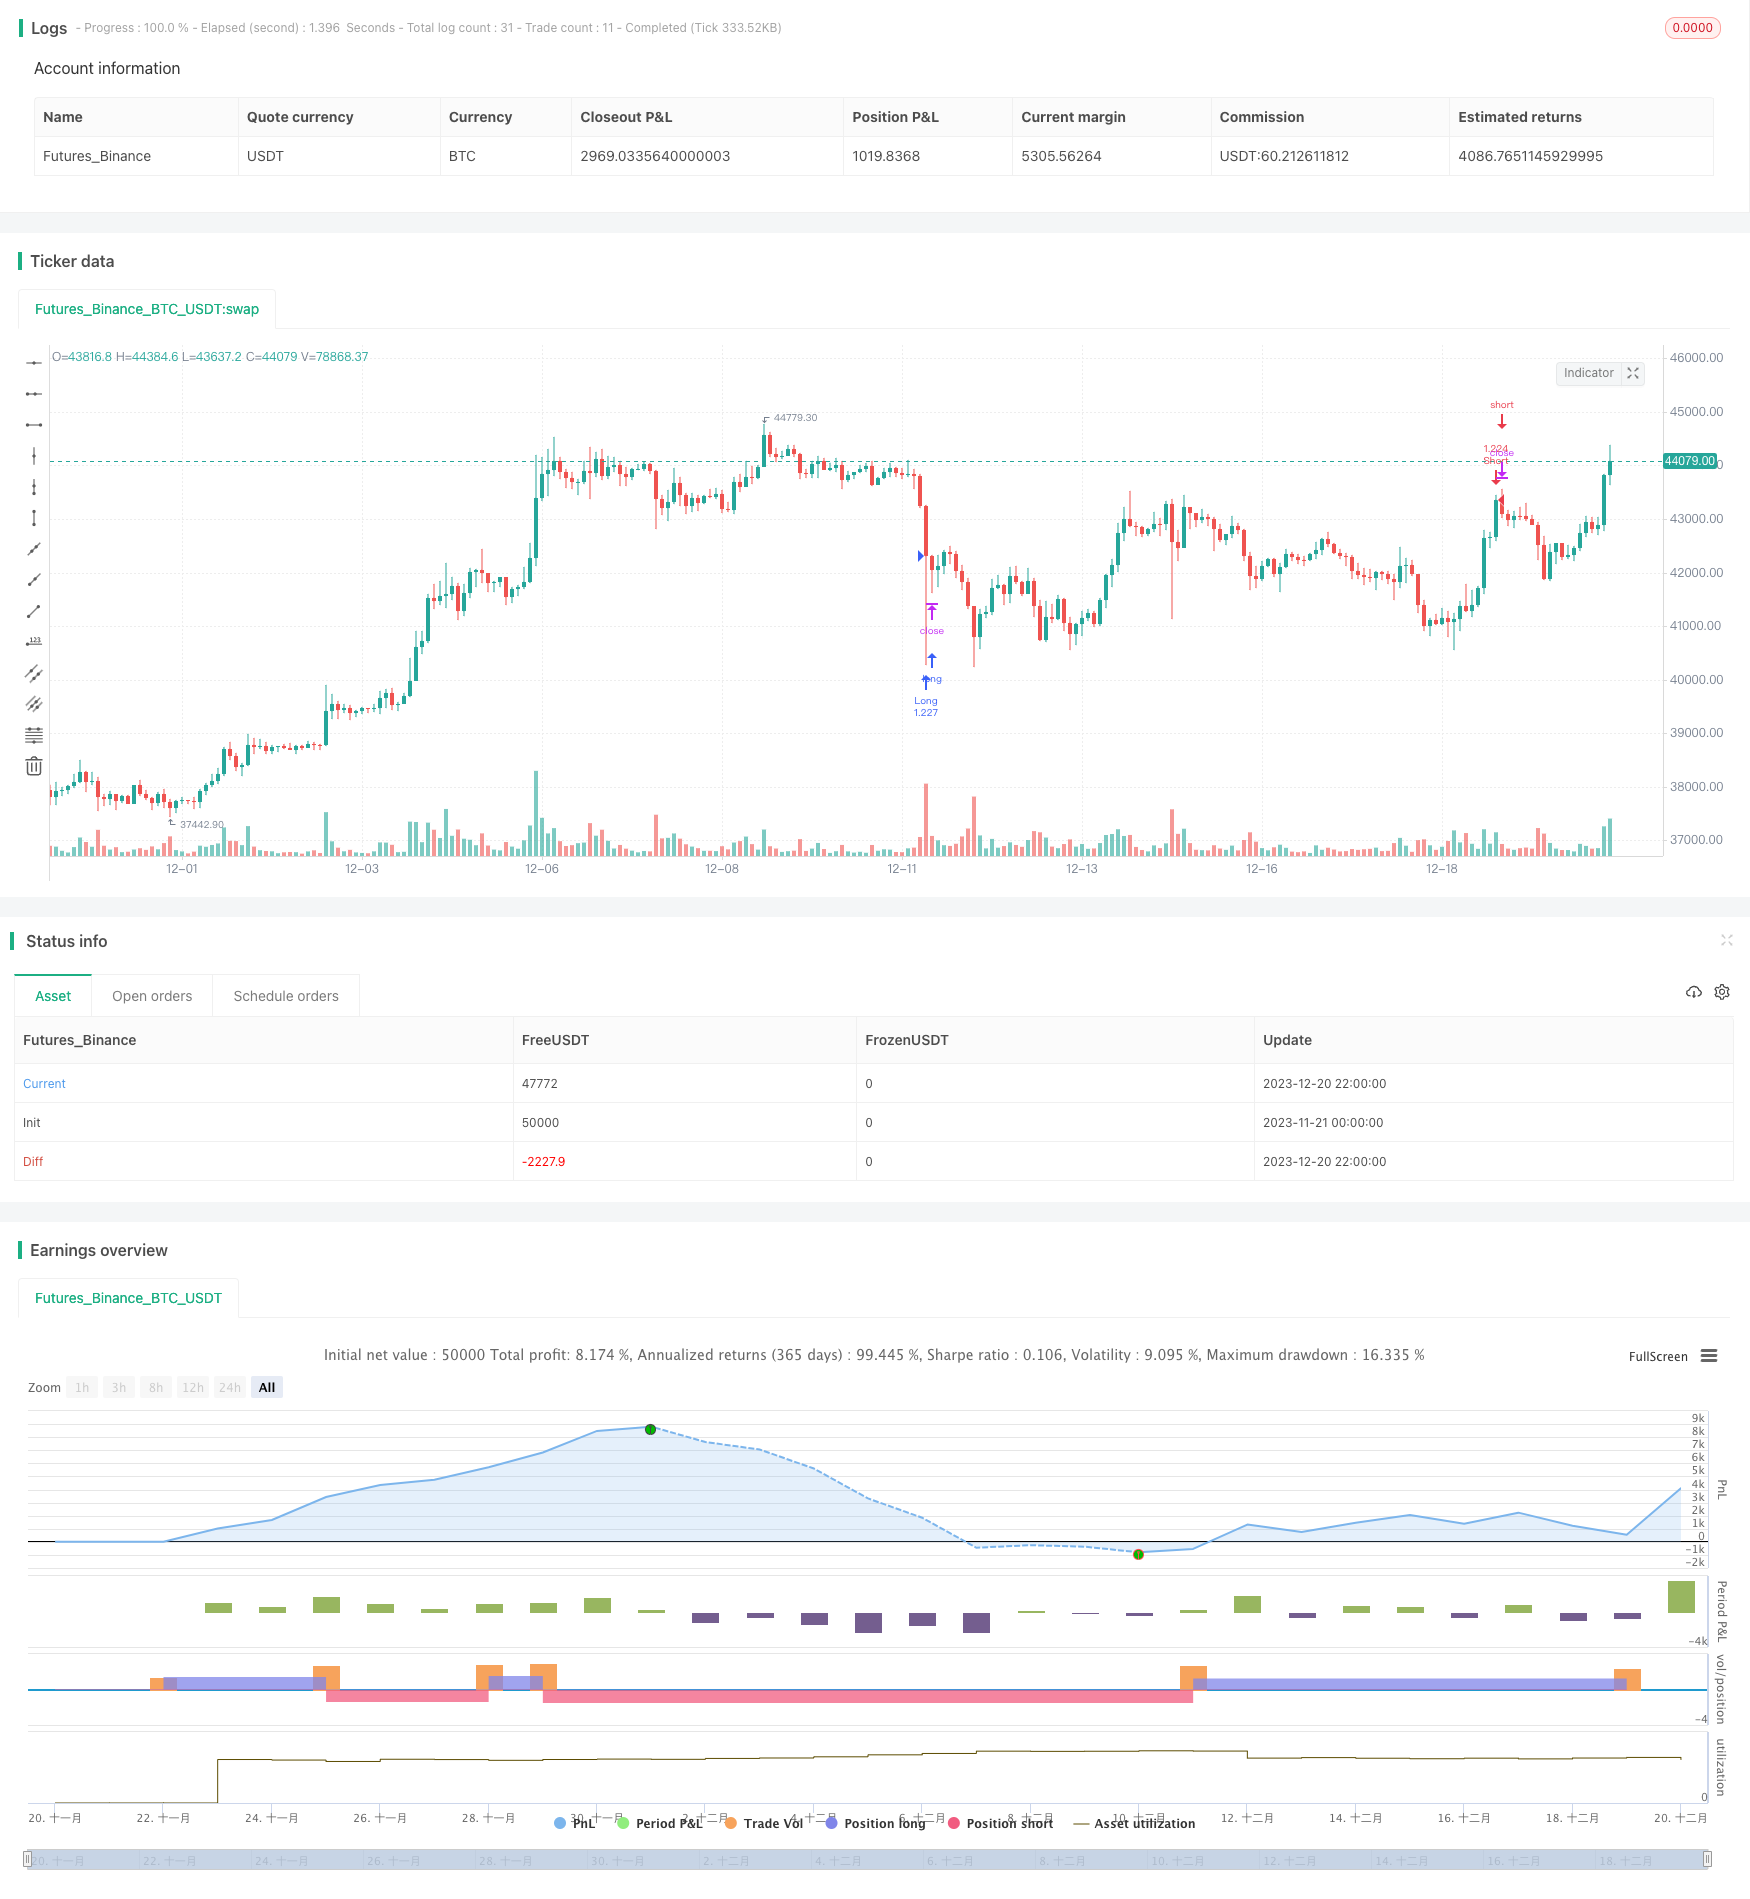
/*backtest
start: 2023-11-21 00:00:00
end: 2023-12-21 00:00:00
period: 2h
basePeriod: 15m
exchanges: [{"eid":"Futures_Binance","currency":"BTC_USDT"}]
*/

// @version=4
// This source code is subject to the terms of the Mozilla Public License 2.0 at https://mozilla.org/MPL/2.0/
// © Bunghole 2021

strategy(title="My New Strategy", initial_capital = 100000, default_qty_type = strategy.percent_of_equity, default_qty_value = 100, pyramiding = 0, currency = 'USD', overlay=true)

//// Stoploss and Take Profit Parameters
// Enable Long Strategy
enable_long_strategy = input(true, title="Enable Long Strategy", group="SL/TP For Long Strategy",inline="1")
long_stoploss_value = input(defval=50, title='Stoploss %', type=input.float, minval=0.1, group="SL/TP For Long Strategy",inline="2")
long_stoploss_percentage = (close * (long_stoploss_value / 100)) / syminfo.mintick
long_takeprofit_value = input(defval=50, title='Take Profit %', type=input.float, minval=0.1, group="SL/TP For Long Strategy",inline="2")
long_takeprofit_percentage = (close * (long_takeprofit_value / 100)) / syminfo.mintick

// Enable Short Strategy
enable_short_strategy = input(true, title="Enable Short Strategy", group="SL/TP For Short Strategy",inline="3")
short_stoploss_value = input(defval=50, title='Stoploss %', type=input.float, minval=0.1, group= "SL/TP For Short Strategy",inline="4")
short_stoploss_percentage = (close * (short_stoploss_value / 100)) / syminfo.mintick
short_takeprofit_value = input(defval=50, title='Take Profit %', type=input.float, minval=0.1, group="SL/TP For Short Strategy",inline="4")
short_takeprofit_percentage = (close * (short_takeprofit_value / 100)) / syminfo.mintick

// Plot Stoploss & Take Profit Levels
long_stoploss_price = strategy.position_avg_price * (1 - long_stoploss_value/100)
long_takeprofit_price = strategy.position_avg_price * (1 + long_takeprofit_value/100)
short_stoploss_price = strategy.position_avg_price * (1 + short_stoploss_value/100)
short_takeprofit_price = strategy.position_avg_price * (1 - short_takeprofit_value/100)
plot(enable_long_strategy and not enable_short_strategy ? long_stoploss_price: na, color=#ff0000, style=plot.style_linebr, linewidth=2, title="Long SL Level")
plot(enable_long_strategy and not enable_short_strategy ? long_takeprofit_price: na, color=#008000, style=plot.style_linebr, linewidth=2, title="Long TP Level")
plot(enable_short_strategy and not enable_long_strategy ? short_stoploss_price: na, color=#ff0000, style=plot.style_linebr, linewidth=2, title="Short SL Level")
plot(enable_short_strategy and not enable_long_strategy ? short_takeprofit_price: na, color=#008000, style=plot.style_linebr, linewidth=2, title="Short TP Level")

// Date Range
start_date = input(title="Start Date", type=input.integer, defval=1, minval=1, maxval=31, group="Date Range")
start_month = input(title="Start Month", type=input.integer, defval=1, minval=1, maxval=12, group="Date Range")
start_year = input(title="Start Year", type=input.integer, defval=1804, minval=1800, maxval=3000, group="Date Range")
end_date = input(title="End Date", type=input.integer, defval=1, minval=1, maxval=3, group="Date Range")
end_month = input(title="End Month", type=input.integer, defval=1, minval=1, maxval=12, group="Date Range")
end_year = input(title="End Year", type=input.integer, defval=2077, minval=1800, maxval=3000, group="Date Range")
in_date_range = (time >= timestamp(syminfo.timezone, start_year, start_month, start_date, 0, 0)) and (time < timestamp(syminfo.timezone, end_year, end_month, end_date, 0, 0))

//// Inputs   **This is where you enter your indicators for your strategy. For example, I added the RSI indicator.**
//RSI
rsi = rsi(close, 14)
rsi_over_sold = rsi < 30
rsi_over_bought = rsi > 70


//// Strategy  **This is where you create your strategy. For example, We have or buy and sell signals.**
// Creating Long and Short Strategy
buy_signal = rsi_over_sold
sell_signal = rsi_over_bought

// Long Strategy
if buy_signal and in_date_range and enable_long_strategy == true
    strategy.entry("Long", true, when=buy_signal, alert_message="Open Long Position")
    strategy.exit("Long  SL/TP", from_entry="Long", loss=long_stoploss_percentage, profit=long_takeprofit_percentage, alert_message="Your Long SL/TP Limit As Been Triggered.")
    strategy.close("Long", when=sell_signal, alert_message="Close Long Position")

// Short Strategy
if sell_signal and in_date_range and enable_short_strategy == true
    strategy.entry("Short", false, when = sell_signal, alert_message="Open Short Position")
    strategy.exit("Short SL/TP", from_entry="Short", loss=short_stoploss_percentage, profit=short_takeprofit_percentage, alert_message="Your Short SL/TP Limit As Been Triggered.")
    strategy.close("Short", when=buy_signal, alert_message="Close Short Position")